Free Statistics

of Irreproducible Research!

Author's title

Author*The author of this computation has been verified*
R Software Modulerwasp_boxcoxlin.wasp
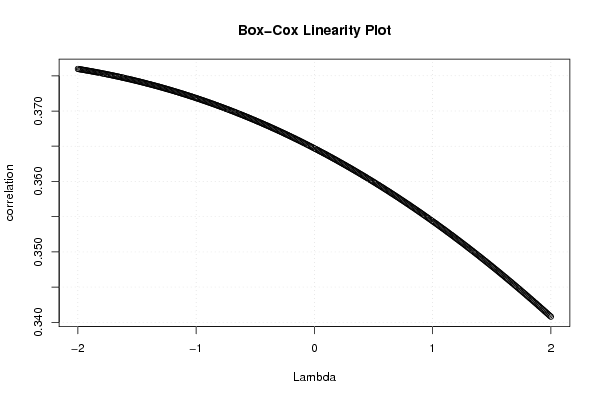
Title produced by softwareBox-Cox Linearity Plot
Date of computationWed, 12 Nov 2008 13:22:23 -0700
Cite this page as followsStatistical Computations at FreeStatistics.org, Office for Research Development and Education, URL https://freestatistics.org/blog/index.php?v=date/2008/Nov/12/t122652141775i8gqcewo8u5oh.htm/, Retrieved Sun, 19 May 2024 10:50:20 +0000
Statistical Computations at FreeStatistics.org, Office for Research Development and Education, URL https://freestatistics.org/blog/index.php?pk=24432, Retrieved Sun, 19 May 2024 10:50:20 +0000
QR Codes:

Original text written by user:
IsPrivate?No (this computation is public)
User-defined keywords
Estimated Impact147
Family? (F = Feedback message, R = changed R code, M = changed R Module, P = changed Parameters, D = changed Data)
F       [Box-Cox Linearity Plot] [various EDA topic...] [2008-11-12 20:22:23] [821c4b3d195be8e737cf8c9dc649d3cf] [Current]
Feedback Forum
2008-11-16 15:46:08 [Gert-Jan Geudens] [reply
De berekeningen van de student zijn goed. Hij had wel het volgende moeten vermelden.
De lineaire transformatie kan plaatsvinden door 'lambda' te introduceren. Uit de bovenste grafiek op deze pagina kunnen we het volgende bemerken :
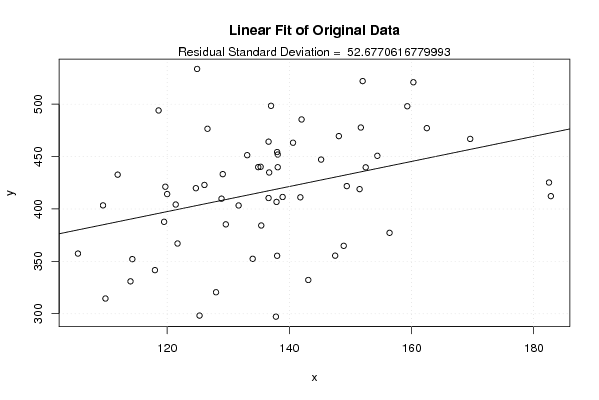
De correlatie tussen de twee variabelen invoer en wisselkoers, bereikt een maximum bij een 'lambda' van ongeveer -2. Als is deze transformatie quasi-overbodig aangezien de correlatie tussen beide variabelen slechts stijgt van 0.34 naar 0.38. We zien dan ook dat er in de scatterplot van de getransformeerde data, nog steeds geen echt verband aanwezig is. Er is dus amper iets veranderd met betrekking tot het verband tussen beide variabelen.
2008-11-17 14:18:43 [Stefan Temmerman] [reply
De student berekent correct de Box-Cox linearity plot, maar legt deze verkeerd uit. Deze plot voert een transformatie door om de variabelen meer lineair te zetten. Hiervoor wordt de functie getest met verschillende lambda's, om zo een beter verband te krijgen. De waarde die de hoogste correlatiecoëfficiënt voor functie oplevert, wordt gekozen om de grafiek te transformeren(te zien op de grafiek als het maximum van de linearity plot).
In het voorbeeld van de student, is de optimale lambda waarde -2. Als we functie transformeren met behulp van deze waarde -2, zou deze een beter verband opleveren. Dit is te merken aan de kleinere standaarddeviatie. Het verband in dit voorbeeld blijft echter klein.
2008-11-19 16:45:23 [Carole Thielens] [reply
De bewerkingen die de student uitvoerde, waren correct. Hij had echter wel veel meer uitleg kunnen geven bij zijn analyse. Bijkomende uitleg over wat een Box-cox linearity plot is, zou daarom ook niet misstaan. De Box-cox linearity plot is een handige grafische techniek om zonder trial and error het effect van de Box- cox transformatie op de X- waarden weer te geven, welke de maximale correlatie tussen twee variabelen tracht te verwezenlijken. Op de horizontale as staat de transformatieparameter lambda, terwijl op de Y-as de correlatiecoëfficiënt tussen Y en de getransformeerde X. De optimale Lambda is deze waarvoor een positieve correlatie maximaal wordt en een negatieve correlatie minimaal wordt. Deze lambda(x) bedraagt -2. Om het effect van de transformatie te zien, moet je beoordelen in welke mate dat de correlatie gestegen is. Dit kan waargenomen worden op de bijhorende scatterplots en tabel. Duidelijk verbeterde de correlatie niet markant. Op de nieuwe scatterplot liggen de punten immers niet opmerkelijk beter verdeeld rond de rechte en uit de tabel blijkt dat de standaarddeviatie niet veel verminderd is.
2008-11-25 00:09:02 [Jessica Alves Pires] [reply
Juiste berekening. Meer uitleg zou gewenst zijn. De transformatie heeft nauwelijks een effect. De student heeft wel tweemaal dezelfde figuur geplakt in het Word document, namelijk de originele. Via deze link kunnen we echter zien dat de transformatie toch niet nuttig is. De punten staan ongeveer op dezelfde plaats. De student stelt dat er een lineair verband bestaat tussen uitvoer en wisselkoers, dat vind ik voorbarig, de punten liggen een beetje overal verspreid.

Post a new message
Dataseries X:
156.4
143.1
148.9
134
118
125.3
138
114
109.9
151.5
129.1
121.7
126.1
114.3
124.7
111.9
120
119.5
137.8
105.4
135.4
182.5
129.6
147.5
128.9
119.7
149.4
136.6
118.6
121.4
138.9
109.5
131.7
160.3
138.1
136.7
126.6
138
152
137
134.9
154.4
145.2
133.1
169.6
159.3
124.9
138.1
162.5
136.6
148.1
142
137.9
152.5
182.8
135.3
141.8
151.7
140.6
128
Dataseries Y:
377,2
332,2
364,8
352,4
341,6
298,2
355,3
330,9
314,5
418,9
433,2
367
422,9
352,1
419,8
432,7
414,2
387,7
297,2
357,4
384,2
425,2
385,3
355,4
409,8
421,2
421,8
464,2
494
404,2
411,4
403,4
403,3
520,9
439,8
434,8
476,5
454,3
522
498,4
439,9
450,7
447,1
451,3
466,8
498
533,6
451,9
477,1
410,4
469,5
485,4
406,7
439,7
412,2
440,2
411,1
477,7
463,2
320,5


Summary of computational transaction
Raw Inputview raw input (R code)
Raw Outputview raw output of R engine
Computing time1 seconds
R Server'Gwilym Jenkins' @ 72.249.127.135

\begin{tabular}{lllllllll}
\hline
Summary of computational transaction \tabularnewline
Raw Input & view raw input (R code)  \tabularnewline
Raw Output & view raw output of R engine  \tabularnewline
Computing time & 1 seconds \tabularnewline
R Server & 'Gwilym Jenkins' @ 72.249.127.135 \tabularnewline
\hline
\end{tabular}
%Source: https://freestatistics.org/blog/index.php?pk=24432&T=0

[TABLE]
[ROW][C]Summary of computational transaction[/C][/ROW]
[ROW][C]Raw Input[/C][C]view raw input (R code) [/C][/ROW]
[ROW][C]Raw Output[/C][C]view raw output of R engine [/C][/ROW]
[ROW][C]Computing time[/C][C]1 seconds[/C][/ROW]
[ROW][C]R Server[/C][C]'Gwilym Jenkins' @ 72.249.127.135[/C][/ROW]
[/TABLE]
Source: https://freestatistics.org/blog/index.php?pk=24432&T=0

Globally Unique Identifier (entire table): ba.freestatistics.org/blog/index.php?pk=24432&T=0

As an alternative you can also use a QR Code:  

The GUIDs for individual cells are displayed in the table below:

Summary of computational transaction
Raw Inputview raw input (R code)
Raw Outputview raw output of R engine
Computing time1 seconds
R Server'Gwilym Jenkins' @ 72.249.127.135


Box-Cox Linearity Plot
# observations x60
maximum correlation0.375970676751562
optimal lambda(x)-2
Residual SD (orginial)52.6770616779993
Residual SD (transformed)52.199467637427

\begin{tabular}{lllllllll}
\hline
Box-Cox Linearity Plot \tabularnewline
# observations x & 60 \tabularnewline
maximum correlation & 0.375970676751562 \tabularnewline
optimal lambda(x) & -2 \tabularnewline
Residual SD (orginial) & 52.6770616779993 \tabularnewline
Residual SD (transformed) & 52.199467637427 \tabularnewline
\hline
\end{tabular}
%Source: https://freestatistics.org/blog/index.php?pk=24432&T=1

[TABLE]
[ROW][C]Box-Cox Linearity Plot[/C][/ROW]
[ROW][C]# observations x[/C][C]60[/C][/ROW]
[ROW][C]maximum correlation[/C][C]0.375970676751562[/C][/ROW]
[ROW][C]optimal lambda(x)[/C][C]-2[/C][/ROW]
[ROW][C]Residual SD (orginial)[/C][C]52.6770616779993[/C][/ROW]
[ROW][C]Residual SD (transformed)[/C][C]52.199467637427[/C][/ROW]
[/TABLE]
Source: https://freestatistics.org/blog/index.php?pk=24432&T=1

Globally Unique Identifier (entire table): ba.freestatistics.org/blog/index.php?pk=24432&T=1

As an alternative you can also use a QR Code:  

The GUIDs for individual cells are displayed in the table below:

Box-Cox Linearity Plot
# observations x60
maximum correlation0.375970676751562
optimal lambda(x)-2
Residual SD (orginial)52.6770616779993
Residual SD (transformed)52.199467637427


Parameters (Session):
Parameters (R input):
R code (references can be found in the software module):
n <- length(x)
c <- array(NA,dim=c(401))
l <- array(NA,dim=c(401))
mx <- 0
mxli <- -999
for (i in 1:401)
{
l[i] <- (i-201)/100
if (l[i] != 0)
{
x1 <- (x^l[i] - 1) / l[i]
} else {
x1 <- log(x)
}
c[i] <- cor(x1,y)
if (mx < abs(c[i]))
{
mx <- abs(c[i])
mxli <- l[i]
}
}
c
mx
mxli
if (mxli != 0)
{
x1 <- (x^mxli - 1) / mxli
} else {
x1 <- log(x)
}
r<-lm(y~x)
se <- sqrt(var(r$residuals))
r1 <- lm(y~x1)
se1 <- sqrt(var(r1$residuals))
bitmap(file='test1.png')
plot(l,c,main='Box-Cox Linearity Plot',xlab='Lambda',ylab='correlation')
grid()
dev.off()
bitmap(file='test2.png')
plot(x,y,main='Linear Fit of Original Data',xlab='x',ylab='y')
abline(r)
grid()
mtext(paste('Residual Standard Deviation = ',se))
dev.off()
bitmap(file='test3.png')
plot(x1,y,main='Linear Fit of Transformed Data',xlab='x',ylab='y')
abline(r1)
grid()
mtext(paste('Residual Standard Deviation = ',se1))
dev.off()
load(file='createtable')
a<-table.start()
a<-table.row.start(a)
a<-table.element(a,'Box-Cox Linearity Plot',2,TRUE)
a<-table.row.end(a)
a<-table.row.start(a)
a<-table.element(a,'# observations x',header=TRUE)
a<-table.element(a,n)
a<-table.row.end(a)
a<-table.row.start(a)
a<-table.element(a,'maximum correlation',header=TRUE)
a<-table.element(a,mx)
a<-table.row.end(a)
a<-table.row.start(a)
a<-table.element(a,'optimal lambda(x)',header=TRUE)
a<-table.element(a,mxli)
a<-table.row.end(a)
a<-table.row.start(a)
a<-table.element(a,'Residual SD (orginial)',header=TRUE)
a<-table.element(a,se)
a<-table.row.end(a)
a<-table.row.start(a)
a<-table.element(a,'Residual SD (transformed)',header=TRUE)
a<-table.element(a,se1)
a<-table.row.end(a)
a<-table.end(a)
table.save(a,file='mytable.tab')