Free Statistics

of Irreproducible Research!

Author's title

Author*Unverified author*
R Software Modulerwasp_boxcoxnorm.wasp
Title produced by softwareBox-Cox Normality Plot
Date of computationWed, 12 Nov 2008 12:10:31 -0700
Cite this page as followsStatistical Computations at FreeStatistics.org, Office for Research Development and Education, URL https://freestatistics.org/blog/index.php?v=date/2008/Nov/12/t1226517094xr59px0prcrik6u.htm/, Retrieved Sun, 19 May 2024 09:18:11 +0000
Statistical Computations at FreeStatistics.org, Office for Research Development and Education, URL https://freestatistics.org/blog/index.php?pk=24391, Retrieved Sun, 19 May 2024 09:18:11 +0000
QR Codes:

Original text written by user:
IsPrivate?No (this computation is public)
User-defined keywords
Estimated Impact146
Family? (F = Feedback message, R = changed R code, M = changed R Module, P = changed Parameters, D = changed Data)
F       [Box-Cox Normality Plot] [various eda box c...] [2008-11-12 19:10:31] [b09437381d488816ab9f5cf07e347c02] [Current]
Feedback Forum
2008-11-18 11:34:54 [Loïque Verhasselt] [reply
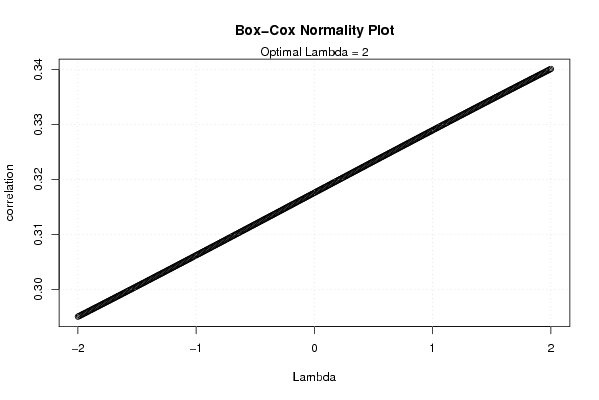
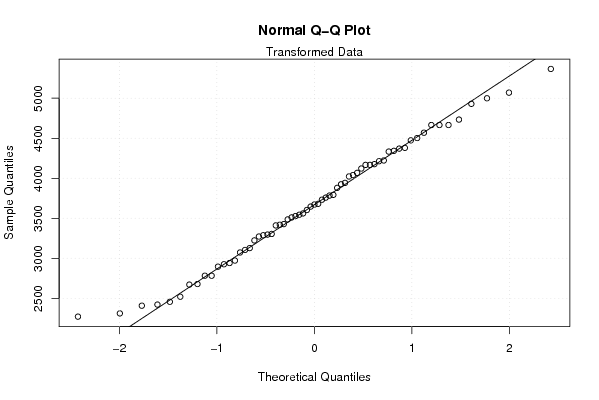
De student gebruikt hier de juiste methode. Een korte conclusie wordt gevonden.De bedoeling is hier om te onderzoeken of je endogene tijdreeks een normaal verdeling beschrijft of niet. Men probeert hier ook een transformatie door te voeren om de tijdreeks meer normaal te maken. Men ziet hier duidelijk dat deze op de regressierechte liggen. Wat de endogene variabele normaal verdeeld maakt.
2008-11-19 16:11:21 [Ken Wright] [reply
Hier heb ik de juiste grafiek en een juist besluit geformuleerd.
2008-11-23 17:59:01 [Jasmine Hendrikx] [reply
Evaluatie Q4:
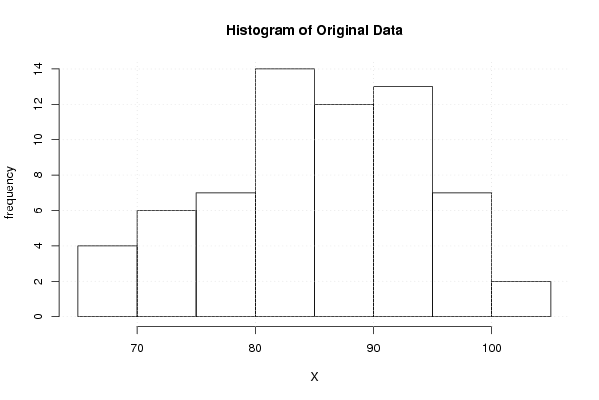
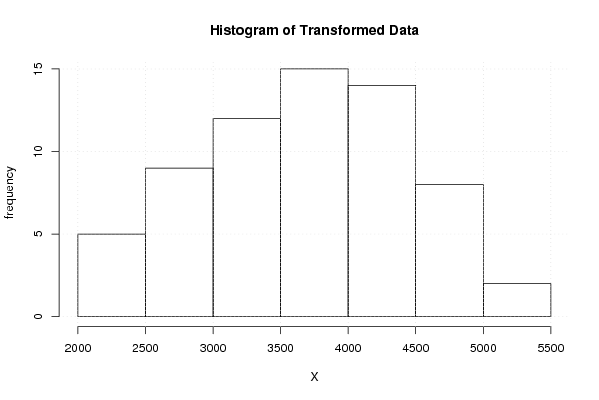
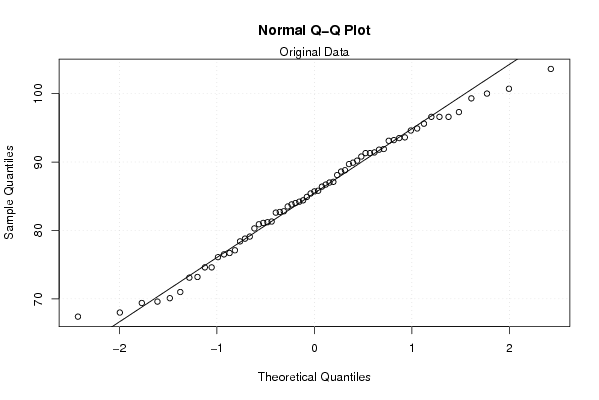
De methode is goed uitgevoerd. Een box-cox normality plot probeert er voor te zorgen dat de verdeling van de tijdreeks meer op een normaalverdeling gaat lijken. Bij de box-cox normality plot vinden we terug dat de optimale lambda 2 bedraagt. Als we echter naar de grafiek kijken, zouden we dit in twijfel kunnen trekken, aangezien er bij lambda = 2 geen maximum wordt bereikt (het is namelijk een rechte). Op de y-as van de box-cox normality plot vinden we de correlatiecoëfficiënt terug. Deze correlatie heeft betrekking op de normal QQ plot. Als we veronderstellen dat bij λ =2 wel een maximum wordt bereikt, dan zien we dat deze transformatie niet echt voor een grote verbetering zorgt. Uit de histogrammen kunnen we wel afleiden dat de transformatie zorgt voor een verdeling die meer normaal verdeeld is, zoals vermeld werd. Als we kijken naar de normal q-q plot zien we een heel kleine verbetering.
2008-11-24 18:34:31 [Jan De Vleeschauwer] [reply
juiste methode en inderdaad een juist besluit

Post a new message
Dataseries X:
70.1
86.7
86.4
89.9
88.1
78.8
81.1
85.4
82.6
80.3
81.2
68
67.4
91.3
94.9
82.8
88.6
73.1
76.7
93.2
84.9
83.8
93.5
91.9
69.6
87
90.2
82.7
91.4
74.6
76.1
87.1
78.4
81.3
99.3
71
73.2
95.6
84
90.8
93.6
80.9
84.4
97.3
83.5
88.8
100.7
69.4
74.6
96.6
96.6
93.1
91.8
85.7
79.1
91.3
84.2
85.8
94.6
77.1
76.5
89.7
103.6
100
96.6


Summary of computational transaction
Raw Inputview raw input (R code)
Raw Outputview raw output of R engine
Computing time3 seconds
R Server'Herman Ole Andreas Wold' @ 193.190.124.10:1001

\begin{tabular}{lllllllll}
\hline
Summary of computational transaction \tabularnewline
Raw Input & view raw input (R code)  \tabularnewline
Raw Output & view raw output of R engine  \tabularnewline
Computing time & 3 seconds \tabularnewline
R Server & 'Herman Ole Andreas Wold' @ 193.190.124.10:1001 \tabularnewline
\hline
\end{tabular}
%Source: https://freestatistics.org/blog/index.php?pk=24391&T=0

[TABLE]
[ROW][C]Summary of computational transaction[/C][/ROW]
[ROW][C]Raw Input[/C][C]view raw input (R code) [/C][/ROW]
[ROW][C]Raw Output[/C][C]view raw output of R engine [/C][/ROW]
[ROW][C]Computing time[/C][C]3 seconds[/C][/ROW]
[ROW][C]R Server[/C][C]'Herman Ole Andreas Wold' @ 193.190.124.10:1001[/C][/ROW]
[/TABLE]
Source: https://freestatistics.org/blog/index.php?pk=24391&T=0

Globally Unique Identifier (entire table): ba.freestatistics.org/blog/index.php?pk=24391&T=0

As an alternative you can also use a QR Code:  

The GUIDs for individual cells are displayed in the table below:

Summary of computational transaction
Raw Inputview raw input (R code)
Raw Outputview raw output of R engine
Computing time3 seconds
R Server'Herman Ole Andreas Wold' @ 193.190.124.10:1001


Box-Cox Normality Plot
# observations x65
maximum correlation0.340139023839821
optimal lambda2

\begin{tabular}{lllllllll}
\hline
Box-Cox Normality Plot \tabularnewline
# observations x & 65 \tabularnewline
maximum correlation & 0.340139023839821 \tabularnewline
optimal lambda & 2 \tabularnewline
\hline
\end{tabular}
%Source: https://freestatistics.org/blog/index.php?pk=24391&T=1

[TABLE]
[ROW][C]Box-Cox Normality Plot[/C][/ROW]
[ROW][C]# observations x[/C][C]65[/C][/ROW]
[ROW][C]maximum correlation[/C][C]0.340139023839821[/C][/ROW]
[ROW][C]optimal lambda[/C][C]2[/C][/ROW]
[/TABLE]
Source: https://freestatistics.org/blog/index.php?pk=24391&T=1

Globally Unique Identifier (entire table): ba.freestatistics.org/blog/index.php?pk=24391&T=1

As an alternative you can also use a QR Code:  

The GUIDs for individual cells are displayed in the table below:

Box-Cox Normality Plot
# observations x65
maximum correlation0.340139023839821
optimal lambda2


Parameters (Session):
Parameters (R input):
R code (references can be found in the software module):
n <- length(x)
c <- array(NA,dim=c(401))
l <- array(NA,dim=c(401))
mx <- 0
mxli <- -999
for (i in 1:401)
{
l[i] <- (i-201)/100
if (l[i] != 0)
{
x1 <- (x^l[i] - 1) / l[i]
} else {
x1 <- log(x)
}
c[i] <- cor(qnorm(ppoints(x), mean=0, sd=1),x1)
if (mx < c[i])
{
mx <- c[i]
mxli <- l[i]
}
}
c
mx
mxli
if (mxli != 0)
{
x1 <- (x^mxli - 1) / mxli
} else {
x1 <- log(x)
}
bitmap(file='test1.png')
plot(l,c,main='Box-Cox Normality Plot',xlab='Lambda',ylab='correlation')
mtext(paste('Optimal Lambda =',mxli))
grid()
dev.off()
bitmap(file='test2.png')
hist(x,main='Histogram of Original Data',xlab='X',ylab='frequency')
grid()
dev.off()
bitmap(file='test3.png')
hist(x1,main='Histogram of Transformed Data',xlab='X',ylab='frequency')
grid()
dev.off()
bitmap(file='test4.png')
qqnorm(x)
qqline(x)
grid()
mtext('Original Data')
dev.off()
bitmap(file='test5.png')
qqnorm(x1)
qqline(x1)
grid()
mtext('Transformed Data')
dev.off()
load(file='createtable')
a<-table.start()
a<-table.row.start(a)
a<-table.element(a,'Box-Cox Normality Plot',2,TRUE)
a<-table.row.end(a)
a<-table.row.start(a)
a<-table.element(a,'# observations x',header=TRUE)
a<-table.element(a,n)
a<-table.row.end(a)
a<-table.row.start(a)
a<-table.element(a,'maximum correlation',header=TRUE)
a<-table.element(a,mx)
a<-table.row.end(a)
a<-table.row.start(a)
a<-table.element(a,'optimal lambda',header=TRUE)
a<-table.element(a,mxli)
a<-table.row.end(a)
a<-table.end(a)
table.save(a,file='mytable.tab')