Free Statistics

of Irreproducible Research!

Author's title

Author*Unverified author*
R Software Modulerwasp_cloud.wasp
Title produced by softwareTrivariate Scatterplots
Date of computationWed, 12 Nov 2008 11:39:40 -0700
Cite this page as followsStatistical Computations at FreeStatistics.org, Office for Research Development and Education, URL https://freestatistics.org/blog/index.php?v=date/2008/Nov/12/t1226515233ryvlpjztgyk4xwp.htm/, Retrieved Sun, 19 May 2024 10:05:23 +0000
Statistical Computations at FreeStatistics.org, Office for Research Development and Education, URL https://freestatistics.org/blog/index.php?pk=24370, Retrieved Sun, 19 May 2024 10:05:23 +0000
QR Codes:

Original text written by user:
IsPrivate?No (this computation is public)
User-defined keywordsSeverijns Britt
Estimated Impact165
Family? (F = Feedback message, R = changed R code, M = changed R Module, P = changed Parameters, D = changed Data)
-     [Bivariate Kernel Density Estimation] [Variuos EDA topic...] [2008-11-09 13:17:45] [3548296885df7a66ea8efc200c4aca50]
F RMPD    [Trivariate Scatterplots] [various EDA topic...] [2008-11-12 18:39:40] [78308c9f3efc33d1da821bcd963df161] [Current]
Feedback Forum
2008-11-23 15:53:27 [Aurélie Van Impe] [reply
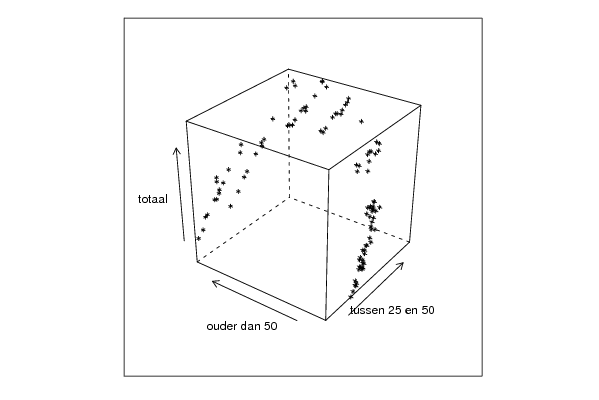
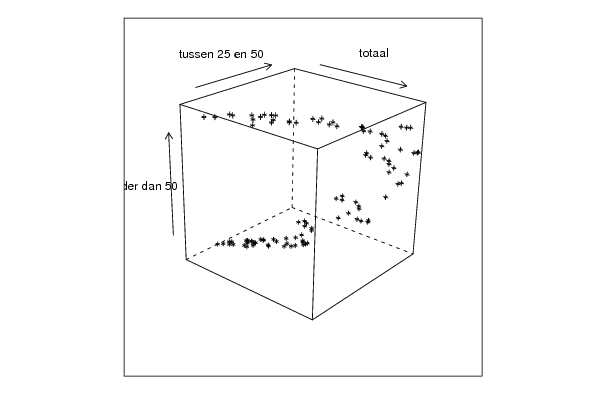
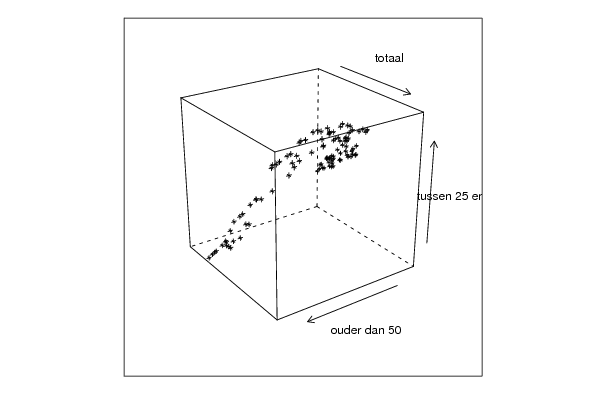
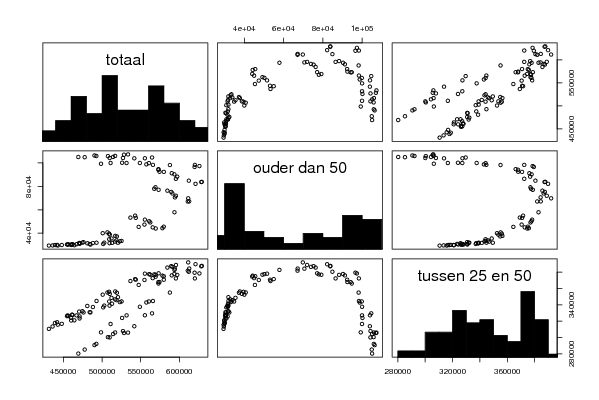
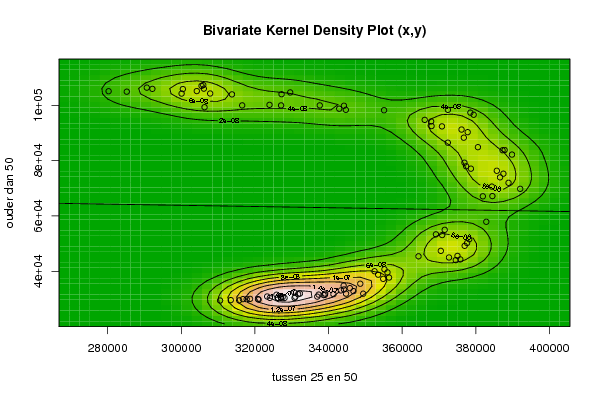
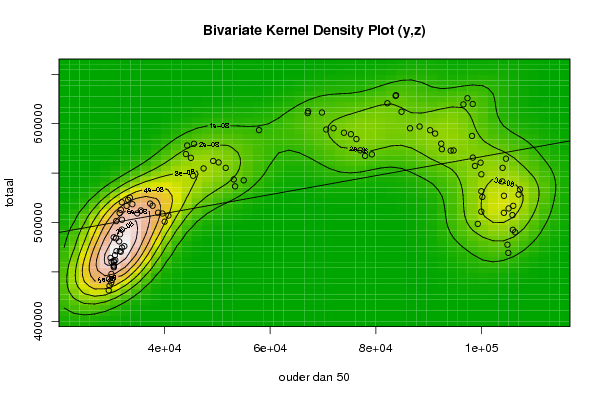
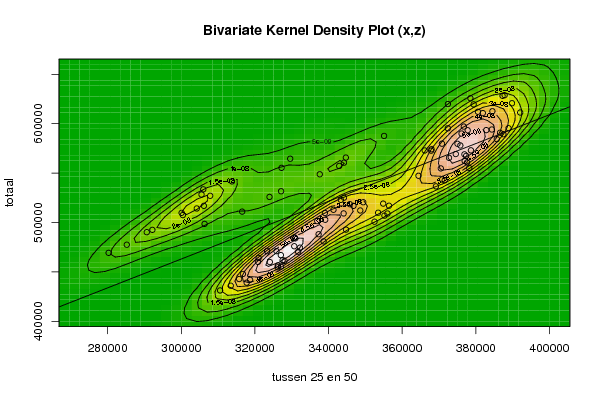
Blijkbaar kon je uit de grafiek niets afleiden. Deze weergavevorm geeft het gelijktijdig verband tussen 3 variabelen. Aangezien we op ons scherm maar 2 dimensies kunnen zien, werd de kubus enkele keren geroteerd, zodat we alle kanten konden bekijken. Op de enige richting die jij weergegeven hebt, zie je duidelijk dat de gegevens in een boog liggen. De gegevens liggen allemaal rond die parabool geconcentreerd. Er moet dus wel een verband zijn tussen de variabelen, maar geen lineair. Je had op de pagina van de output nog naar onder kunnen scrollen, en daar had je nog de 2 andere richtingen van de kubus kunnen zien, en nog meer naar onder staat een 2 dimensionale weergave van de gegevens. Er werd telkens 1 reeks gegevens weggelaten, om zo het verband tussen de andere 2 te kunnen zien. Ook in deze weergavevorm zie je bij elke correlatiegrafiek duidelijk een boog. Er is dus geen lineair verband tussen de gegevens te bespeuren. Het best mogelijke verband ligt tussen de variabelen 'totale werkloosheid' en 'werklozen tussen 25 en 50'. Dit werd ook aangetoond in de bivariate kernel density plot. De gegevens liggen in ellipsvormige clusters van links onder naar rechts boven, wat wijst op een positief verband. Ook in het rooster met de tweedimensionale correlaties, is de correlatie tussen deze variabelen het grootst, zij liggen het meest op een diagonaal. Maar dit beeld is min of meer vertekend, omdat er een dimensie ontbreekt.
2008-11-23 17:40:39 [7bf28d4d60530086dbc44ae6b648927e] [reply
De trivariate scatterplot geeft het verband tussen 3 variabelen in een kubusvorm. Naargelang de rotatie van de kubussen ziet men andere dingen. Daarom kunnen we beter gebruik maken van de gestandaardiseerde projecties. De scatterplots kunnen wel vertekent omdat we hier gebruiken maken van 2 dimensies.

Post a new message
Dataseries X:
344744
338653
327532
326225
318672
317756
337302
349420
336923
330758
321002
320820
327032
324047
316735
315710
313427
310527
330962
339015
341332
339092
323308
325849
330675
332225
331735
328047
326165
327081
346764
344190
343333
345777
344094
348609
354846
356427
353467
355996
352487
355178
374556
375021
375787
372720
364431
370490
376974
377632
378205
370861
369167
371551
382842
381903
384502
392058
384359
388884
386586
387495
385705
378670
377367
376911
389827
387820
387267
380575
372402
376740
377795
376126
370804
367980
367866
366121
379421
378519
372423
355072
344693
342892
344178
337606
327103
323953
316532
306307
327225
329573
313761
307836
300074
304198
306122
300414
292133
290616
280244
285179
305486
305957
Dataseries Y:
31899
31384
30650
30400
30003
29896
31557
31883
30830
30354
29756
29934
30599
30378
29925
29471
29567
29419
30796
31475
31708
31917
30871
31512
32362
31928
31699
30363
30386
30364
32806
33423
33071
33888
34805
35489
37259
37722
38764
39594
40004
40715
44028
45564
44277
44976
45406
47379
49200
50221
51573
53091
53337
54978
57885
67099
67169
69796
70600
71982
73957
75273
76322
77078
77954
79238
82179
83834
83744
84861
86478
88290
90287
91230
92380
92506
94172
94728
96581
97344
98346
98214
98366
98768
99832
99976
99961
100164
99964
99304
104008
104644
103950
104263
104241
105141
106018
105866
105944
106379
105082
104915
107026
107306
Dataseries Z:
492865
480961
461935
456608
441977
439148
488180
520564
501492
485025
464196
460170
467037
460070
447988
442867
436087
431328
484015
509673
512927
502831
470984
471067
476049
474605
470439
461251
454724
455626
516847
525192
522975
518585
509239
512238
519164
517009
509933
509127
500857
506971
569323
579714
577992
565464
547344
554788
562325
560854
555332
543599
536662
542722
593530
610763
612613
611324
594167
595454
590865
589379
584428
573100
567456
569028
620735
628884
628232
612117
595404
597141
593408
590072
579799
574205
572775
572942
619567
625809
619916
587625
565742
557274
560576
548854
531673
525919
511038
498662
555362
564591
541657
527070
509846
514258
516922
507561
492622
490243
469357
477580
528379
533590


Summary of computational transaction
Raw Inputview raw input (R code)
Raw Outputview raw output of R engine
Computing time6 seconds
R Server'Sir Ronald Aylmer Fisher' @ 193.190.124.24

\begin{tabular}{lllllllll}
\hline
Summary of computational transaction \tabularnewline
Raw Input & view raw input (R code)  \tabularnewline
Raw Output & view raw output of R engine  \tabularnewline
Computing time & 6 seconds \tabularnewline
R Server & 'Sir Ronald Aylmer Fisher' @ 193.190.124.24 \tabularnewline
\hline
\end{tabular}
%Source: https://freestatistics.org/blog/index.php?pk=24370&T=0

[TABLE]
[ROW][C]Summary of computational transaction[/C][/ROW]
[ROW][C]Raw Input[/C][C]view raw input (R code) [/C][/ROW]
[ROW][C]Raw Output[/C][C]view raw output of R engine [/C][/ROW]
[ROW][C]Computing time[/C][C]6 seconds[/C][/ROW]
[ROW][C]R Server[/C][C]'Sir Ronald Aylmer Fisher' @ 193.190.124.24[/C][/ROW]
[/TABLE]
Source: https://freestatistics.org/blog/index.php?pk=24370&T=0

Globally Unique Identifier (entire table): ba.freestatistics.org/blog/index.php?pk=24370&T=0

As an alternative you can also use a QR Code:  

The GUIDs for individual cells are displayed in the table below:

Summary of computational transaction
Raw Inputview raw input (R code)
Raw Outputview raw output of R engine
Computing time6 seconds
R Server'Sir Ronald Aylmer Fisher' @ 193.190.124.24


Parameters (Session):
Parameters (R input):
par1 = 50 ; par2 = 50 ; par3 = Y ; par4 = Y ; par5 = tussen 25 en 50 ; par6 = ouder dan 50 ; par7 = totaal ;
R code (references can be found in the software module):
x <- array(x,dim=c(length(x),1))
colnames(x) <- par5
y <- array(y,dim=c(length(y),1))
colnames(y) <- par6
z <- array(z,dim=c(length(z),1))
colnames(z) <- par7
d <- data.frame(cbind(z,y,x))
colnames(d) <- list(par7,par6,par5)
par1 <- as.numeric(par1)
par2 <- as.numeric(par2)
if (par1>500) par1 <- 500
if (par2>500) par2 <- 500
if (par1<10) par1 <- 10
if (par2<10) par2 <- 10
library(GenKern)
library(lattice)
panel.hist <- function(x, ...)
{
usr <- par('usr'); on.exit(par(usr))
par(usr = c(usr[1:2], 0, 1.5) )
h <- hist(x, plot = FALSE)
breaks <- h$breaks; nB <- length(breaks)
y <- h$counts; y <- y/max(y)
rect(breaks[-nB], 0, breaks[-1], y, col='black', ...)
}
bitmap(file='cloud1.png')
cloud(z~x*y, screen = list(x=-45, y=45, z=35),xlab=par5,ylab=par6,zlab=par7)
dev.off()
bitmap(file='cloud2.png')
cloud(z~x*y, screen = list(x=35, y=45, z=25),xlab=par5,ylab=par6,zlab=par7)
dev.off()
bitmap(file='cloud3.png')
cloud(z~x*y, screen = list(x=35, y=-25, z=90),xlab=par5,ylab=par6,zlab=par7)
dev.off()
bitmap(file='pairs.png')
pairs(d,diag.panel=panel.hist)
dev.off()
x <- as.vector(x)
y <- as.vector(y)
z <- as.vector(z)
bitmap(file='bidensity1.png')
op <- KernSur(x,y, xgridsize=par1, ygridsize=par2, correlation=cor(x,y), xbandwidth=dpik(x), ybandwidth=dpik(y))
image(op$xords, op$yords, op$zden, col=terrain.colors(100), axes=TRUE,main='Bivariate Kernel Density Plot (x,y)',xlab=par5,ylab=par6)
if (par3=='Y') contour(op$xords, op$yords, op$zden, add=TRUE)
if (par4=='Y') points(x,y)
(r<-lm(y ~ x))
abline(r)
box()
dev.off()
bitmap(file='bidensity2.png')
op <- KernSur(y,z, xgridsize=par1, ygridsize=par2, correlation=cor(y,z), xbandwidth=dpik(y), ybandwidth=dpik(z))
op
image(op$xords, op$yords, op$zden, col=terrain.colors(100), axes=TRUE,main='Bivariate Kernel Density Plot (y,z)',xlab=par6,ylab=par7)
if (par3=='Y') contour(op$xords, op$yords, op$zden, add=TRUE)
if (par4=='Y') points(y,z)
(r<-lm(z ~ y))
abline(r)
box()
dev.off()
bitmap(file='bidensity3.png')
op <- KernSur(x,z, xgridsize=par1, ygridsize=par2, correlation=cor(x,z), xbandwidth=dpik(x), ybandwidth=dpik(z))
op
image(op$xords, op$yords, op$zden, col=terrain.colors(100), axes=TRUE,main='Bivariate Kernel Density Plot (x,z)',xlab=par5,ylab=par7)
if (par3=='Y') contour(op$xords, op$yords, op$zden, add=TRUE)
if (par4=='Y') points(x,z)
(r<-lm(z ~ x))
abline(r)
box()
dev.off()