Free Statistics

of Irreproducible Research!

Author's title

Author*Unverified author*
R Software Modulerwasp_cloud.wasp
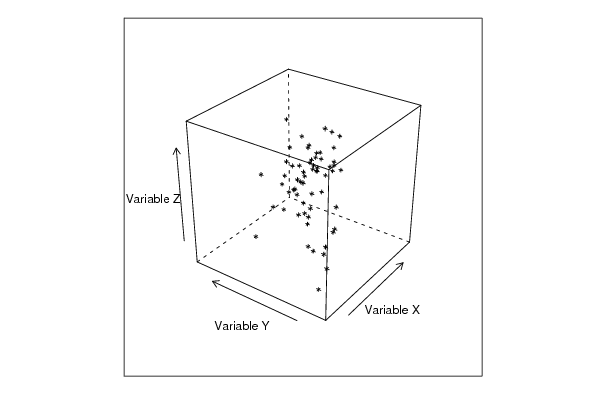
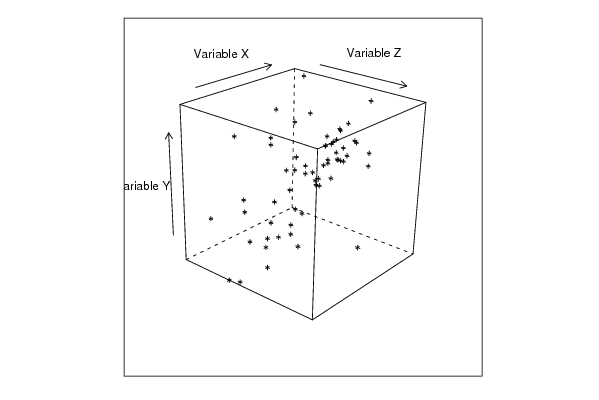
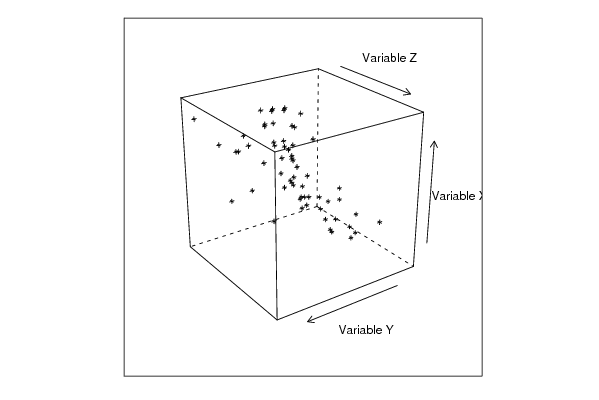
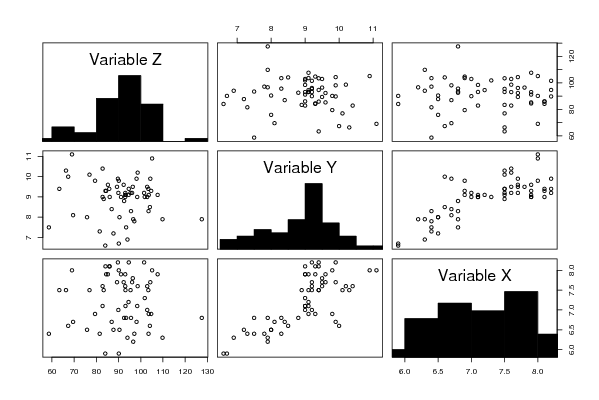
Title produced by softwareTrivariate Scatterplots
Date of computationWed, 12 Nov 2008 10:55:41 -0700
Cite this page as followsStatistical Computations at FreeStatistics.org, Office for Research Development and Education, URL https://freestatistics.org/blog/index.php?v=date/2008/Nov/12/t12265135090ko61hkg87h9hzt.htm/, Retrieved Sun, 19 May 2024 09:22:54 +0000
Statistical Computations at FreeStatistics.org, Office for Research Development and Education, URL https://freestatistics.org/blog/index.php?pk=24342, Retrieved Sun, 19 May 2024 09:22:54 +0000
QR Codes:

Original text written by user:
IsPrivate?No (this computation is public)
User-defined keywordskleuter
Estimated Impact166
Family? (F = Feedback message, R = changed R code, M = changed R Module, P = changed Parameters, D = changed Data)
F       [Trivariate Scatterplots] [] [2008-11-12 17:55:41] [b5c0979bf79a38ace87e0d3abace1ca1] [Current]
Feedback Forum
2008-11-20 12:30:51 [Steven Vanhooreweghe] [reply
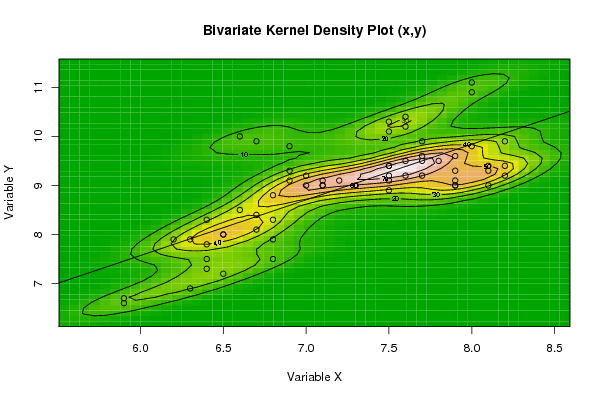
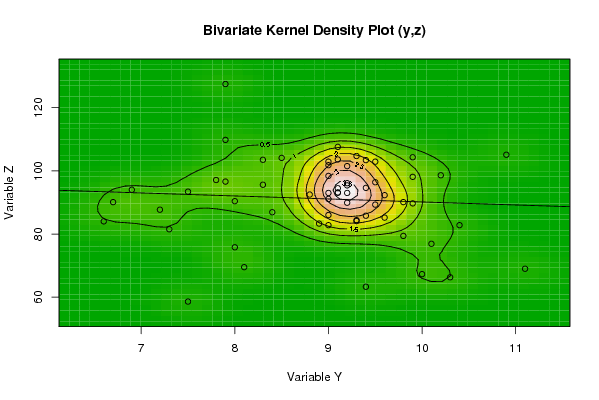
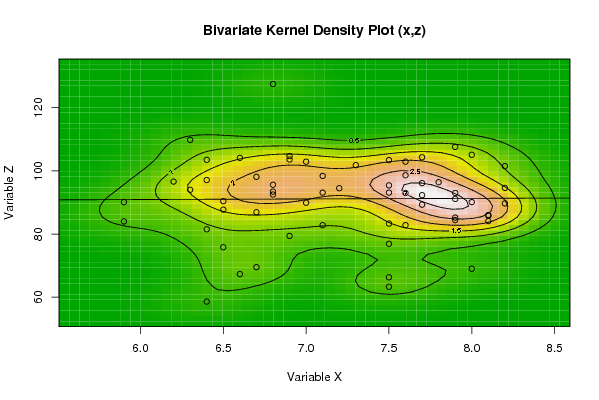
Er is enkel een verband tussen de werkloosheid bij vrouwen en de werkloosheid bij mannen. Dit wordt ook in de bivariate densityplot aangetoond. De regressielijn benadert zo dicht mogelijk de puntenwolk, de hoogtelijnen hebben te maken met de concentratie van de punten. Deze methode wordt ook gebruikt om scatterplots op een andere, soms betere manier te bekijken. Een ellipsvormige hoogtelijn wijst op een positief verband, een cirkelvormige hoogtelijn op geen verband. Zoals je kan zien heeft X,Z een cirkelvormige hoogtelijn.De Partial correlation ontbreekt hier blijkbaar, maar als ik het me nog goed herinner bevestigde die alleen maar wat hierboven al staat.

Post a new message
Dataseries X:
7.5
7.6
7.9
7.9
8.1
8.2
8
7.5
6.8
6.5
6.6
7.6
8
8
7.7
7.5
7.6
7.7
7.9
7.8
7.5
7.5
7.1
7.5
7.5
7.6
7.7
7.7
7.9
8.1
8.2
8.2
8.1
7.9
7.3
6.9
6.6
6.7
6.9
7
7.1
7.2
7.1
6.9
7
6.8
6.4
6.7
6.7
6.4
6.3
6.2
6.5
6.8
6.8
6.5
6.3
5.9
5.9
6.4
6.4
Dataseries Y:
9.4
9.5
9.1
9
9.3
9.9
9.8
9.4
8.3
8
8.5
10.4
11.1
10.9
9.9
9.2
9.2
9.5
9.6
9.5
9.1
8.9
9
10.1
10.3
10.2
9.6
9.2
9.3
9.4
9.4
9.2
9
9
9
9.8
10
9.9
9.3
9
9
9.1
9.1
9.1
9.2
8.8
8.3
8.4
8.1
7.8
7.9
7.9
8
7.9
7.5
7.2
6.9
6.6
6.7
7.3
7.5
Dataseries Z:
63.3
102.9
107.6
93
84.1
89.7
90.1
103.4
95.6
90.4
104.1
82.8
69
105.1
104.3
95.4
93
89.3
85.2
96.4
93.1
83.3
98.4
76.9
66.3
98.6
92.3
96.1
84.4
85.8
94.6
101.5
86
91.1
101.8
79.4
67.3
98.1
104.7
102.9
82.8
94.5
93.1
103.6
89.9
92.5
103.5
86.9
69.5
97.1
109.8
96.6
75.8
127.5
93.4
87.7
94
84
90.1
81.5
58.6


Summary of computational transaction
Raw Inputview raw input (R code)
Raw Outputview raw output of R engine
Computing time4 seconds
R Server'George Udny Yule' @ 72.249.76.132

\begin{tabular}{lllllllll}
\hline
Summary of computational transaction \tabularnewline
Raw Input & view raw input (R code)  \tabularnewline
Raw Output & view raw output of R engine  \tabularnewline
Computing time & 4 seconds \tabularnewline
R Server & 'George Udny Yule' @ 72.249.76.132 \tabularnewline
\hline
\end{tabular}
%Source: https://freestatistics.org/blog/index.php?pk=24342&T=0

[TABLE]
[ROW][C]Summary of computational transaction[/C][/ROW]
[ROW][C]Raw Input[/C][C]view raw input (R code) [/C][/ROW]
[ROW][C]Raw Output[/C][C]view raw output of R engine [/C][/ROW]
[ROW][C]Computing time[/C][C]4 seconds[/C][/ROW]
[ROW][C]R Server[/C][C]'George Udny Yule' @ 72.249.76.132[/C][/ROW]
[/TABLE]
Source: https://freestatistics.org/blog/index.php?pk=24342&T=0

Globally Unique Identifier (entire table): ba.freestatistics.org/blog/index.php?pk=24342&T=0

As an alternative you can also use a QR Code:  

The GUIDs for individual cells are displayed in the table below:

Summary of computational transaction
Raw Inputview raw input (R code)
Raw Outputview raw output of R engine
Computing time4 seconds
R Server'George Udny Yule' @ 72.249.76.132


Parameters (Session):
par1 = 50 ; par2 = 50 ; par3 = Y ; par4 = Y ; par5 = Variable X ; par6 = Variable Y ; par7 = Variable Z ;
Parameters (R input):
par1 = 50 ; par2 = 50 ; par3 = Y ; par4 = Y ; par5 = Variable X ; par6 = Variable Y ; par7 = Variable Z ;
R code (references can be found in the software module):
x <- array(x,dim=c(length(x),1))
colnames(x) <- par5
y <- array(y,dim=c(length(y),1))
colnames(y) <- par6
z <- array(z,dim=c(length(z),1))
colnames(z) <- par7
d <- data.frame(cbind(z,y,x))
colnames(d) <- list(par7,par6,par5)
par1 <- as.numeric(par1)
par2 <- as.numeric(par2)
if (par1>500) par1 <- 500
if (par2>500) par2 <- 500
if (par1<10) par1 <- 10
if (par2<10) par2 <- 10
library(GenKern)
library(lattice)
panel.hist <- function(x, ...)
{
usr <- par('usr'); on.exit(par(usr))
par(usr = c(usr[1:2], 0, 1.5) )
h <- hist(x, plot = FALSE)
breaks <- h$breaks; nB <- length(breaks)
y <- h$counts; y <- y/max(y)
rect(breaks[-nB], 0, breaks[-1], y, col='black', ...)
}
bitmap(file='cloud1.png')
cloud(z~x*y, screen = list(x=-45, y=45, z=35),xlab=par5,ylab=par6,zlab=par7)
dev.off()
bitmap(file='cloud2.png')
cloud(z~x*y, screen = list(x=35, y=45, z=25),xlab=par5,ylab=par6,zlab=par7)
dev.off()
bitmap(file='cloud3.png')
cloud(z~x*y, screen = list(x=35, y=-25, z=90),xlab=par5,ylab=par6,zlab=par7)
dev.off()
bitmap(file='pairs.png')
pairs(d,diag.panel=panel.hist)
dev.off()
x <- as.vector(x)
y <- as.vector(y)
z <- as.vector(z)
bitmap(file='bidensity1.png')
op <- KernSur(x,y, xgridsize=par1, ygridsize=par2, correlation=cor(x,y), xbandwidth=dpik(x), ybandwidth=dpik(y))
image(op$xords, op$yords, op$zden, col=terrain.colors(100), axes=TRUE,main='Bivariate Kernel Density Plot (x,y)',xlab=par5,ylab=par6)
if (par3=='Y') contour(op$xords, op$yords, op$zden, add=TRUE)
if (par4=='Y') points(x,y)
(r<-lm(y ~ x))
abline(r)
box()
dev.off()
bitmap(file='bidensity2.png')
op <- KernSur(y,z, xgridsize=par1, ygridsize=par2, correlation=cor(y,z), xbandwidth=dpik(y), ybandwidth=dpik(z))
op
image(op$xords, op$yords, op$zden, col=terrain.colors(100), axes=TRUE,main='Bivariate Kernel Density Plot (y,z)',xlab=par6,ylab=par7)
if (par3=='Y') contour(op$xords, op$yords, op$zden, add=TRUE)
if (par4=='Y') points(y,z)
(r<-lm(z ~ y))
abline(r)
box()
dev.off()
bitmap(file='bidensity3.png')
op <- KernSur(x,z, xgridsize=par1, ygridsize=par2, correlation=cor(x,z), xbandwidth=dpik(x), ybandwidth=dpik(z))
op
image(op$xords, op$yords, op$zden, col=terrain.colors(100), axes=TRUE,main='Bivariate Kernel Density Plot (x,z)',xlab=par5,ylab=par7)
if (par3=='Y') contour(op$xords, op$yords, op$zden, add=TRUE)
if (par4=='Y') points(x,z)
(r<-lm(z ~ x))
abline(r)
box()
dev.off()