Free Statistics

of Irreproducible Research!

Author's title

Author*The author of this computation has been verified*
R Software Modulerwasp_boxcoxlin.wasp
Title produced by softwareBox-Cox Linearity Plot
Date of computationWed, 12 Nov 2008 11:08:58 -0700
Cite this page as followsStatistical Computations at FreeStatistics.org, Office for Research Development and Education, URL https://freestatistics.org/blog/index.php?v=date/2008/Nov/12/t1226513379yavq8fux8ucdwmc.htm/, Retrieved Tue, 28 May 2024 10:56:09 +0000
Statistical Computations at FreeStatistics.org, Office for Research Development and Education, URL https://freestatistics.org/blog/index.php?pk=24340, Retrieved Tue, 28 May 2024 10:56:09 +0000
QR Codes:

Original text written by user:
IsPrivate?No (this computation is public)
User-defined keywordsjenske_cole@hotmail.com
Estimated Impact166
Family? (F = Feedback message, R = changed R code, M = changed R Module, P = changed Parameters, D = changed Data)
F     [Box-Cox Linearity Plot] [Various EDA Topic...] [2008-11-12 14:19:21] [8094ad203a218aaca2d1cea2c78c2d6e]
F         [Box-Cox Linearity Plot] [opdracht3 blok8 q3] [2008-11-12 18:08:58] [120dfa2440e51a0cfc0f5296bc5d7460] [Current]
Feedback Forum
2008-11-15 11:47:22 [58d427c57bd46519a715a3a7fea6a80f] [reply
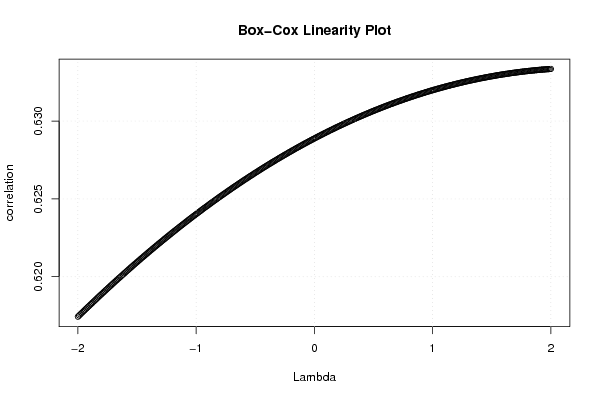
De bedoeling is om 2 variabelen in verband te brengen, we gaan de punten transformeren. De nieuwe lijn is misschien wel een kromme. De box-cox transformatie kan wel wat problemen oplossen R-code x wordt getransformeerd. Correlatie kan je aflezen op de y-as. We hopen op een maximum, in dit geval is die waarschijnlijk 2. Deze transformatie brengt niet veel verbetering.
  2008-11-24 13:46:34 [58d427c57bd46519a715a3a7fea6a80f] [reply
Aanvulling: We moeten niet gaan vergelijken met een beginpunt om na te gaan of de gedane transformatie verloren moeite is. Om dit te kunnen bepalen moeten we kijken naar de schaal op de y-as. Is die maar heel klein, dan heeft de transformatie niet veel effect gehad en was dat dus eigenlijk verloren moeite. Bij de transformatie en het zoeken van een waarde voor lambda moet de x-as telkens variëren tussen -2 en 2. Daar wordt automatisch vanuit gegaan. Als in dit interval geen max voor lambda wordt bereikt, dan moeten we gewoon stellen dat er geen transformatie mogelijk is die de correlatie kan verbeteren.
2008-11-17 15:03:24 [f4fb14dccb656c9eb858fa18c7d28649] [reply
De transformatie is visueel inderdaad niet spectaculair. De transformatie gebeurt door een bepaalde bewerking uit te voeren met elk gegeven, in deze bewerking is er een lambda aanwezig. De optimale transformatie bevindt zich bij lambda = 2 (eigenlijk meer maar er wordt maar onderzocht in het interval [-2;2]). De invloed van de uitgevoerde transformatie is inderdaad beperkt.

Post a new message
Dataseries X:
92.3
95.5
92.5
89.6
84.3
76.3
80.7
96.3
81.0
82.9
90.3
74.8
70.1
86.7
86.4
89.9
88.1
78.8
81.1
85.4
82.6
80.3
81.2
68.0
67.4
91.3
94.9
82.8
88.6
73.1
76.7
93.2
84.9
83.8
93.5
91.9
69.6
87.0
90.2
82.7
91.4
74.6
76.1
87.1
78.4
81.3
99.3
71.0
73.2
95.6
84.0
90.8
93.6
80.9
84.4
97.3
83.5
88.8
100.7
69.4
74.6
96.6
96.6
93.1
91.8
85.7
79.1
91.3
84.2
85.8
94.6
77.1
76.5
Dataseries Y:
95.5
98.7
115.9
110.4
109.5
92.3
102.1
112.8
110.2
98.9
119.0
104.3
98.8
109.4
170.3
118.0
116.9
111.7
116.8
116.1
114.8
110.8
122.8
104.7
86.0
127.2
126.1
114.6
127.8
105.2
113.1
161.0
126.9
117.7
144.9
119.4
107.1
142.8
126.2
126.9
179.2
105.3
114.8
125.4
113.2
134.4
150.0
100.9
101.8
137.7
138.7
135.4
153.8
119.5
123.3
166.4
137.5
142.2
167.0
112.3
120.6
154.9
153.4
156.2
175.8
131.7
130.1
161.1
128.2
140.3
174.9
111.8
136.6


Summary of computational transaction
Raw Inputview raw input (R code)
Raw Outputview raw output of R engine
Computing time2 seconds
R Server'Gwilym Jenkins' @ 72.249.127.135

\begin{tabular}{lllllllll}
\hline
Summary of computational transaction \tabularnewline
Raw Input & view raw input (R code)  \tabularnewline
Raw Output & view raw output of R engine  \tabularnewline
Computing time & 2 seconds \tabularnewline
R Server & 'Gwilym Jenkins' @ 72.249.127.135 \tabularnewline
\hline
\end{tabular}
%Source: https://freestatistics.org/blog/index.php?pk=24340&T=0

[TABLE]
[ROW][C]Summary of computational transaction[/C][/ROW]
[ROW][C]Raw Input[/C][C]view raw input (R code) [/C][/ROW]
[ROW][C]Raw Output[/C][C]view raw output of R engine [/C][/ROW]
[ROW][C]Computing time[/C][C]2 seconds[/C][/ROW]
[ROW][C]R Server[/C][C]'Gwilym Jenkins' @ 72.249.127.135[/C][/ROW]
[/TABLE]
Source: https://freestatistics.org/blog/index.php?pk=24340&T=0

Globally Unique Identifier (entire table): ba.freestatistics.org/blog/index.php?pk=24340&T=0

As an alternative you can also use a QR Code:  

The GUIDs for individual cells are displayed in the table below:

Summary of computational transaction
Raw Inputview raw input (R code)
Raw Outputview raw output of R engine
Computing time2 seconds
R Server'Gwilym Jenkins' @ 72.249.127.135


Box-Cox Linearity Plot
# observations x73
maximum correlation0.633348496466385
optimal lambda(x)2
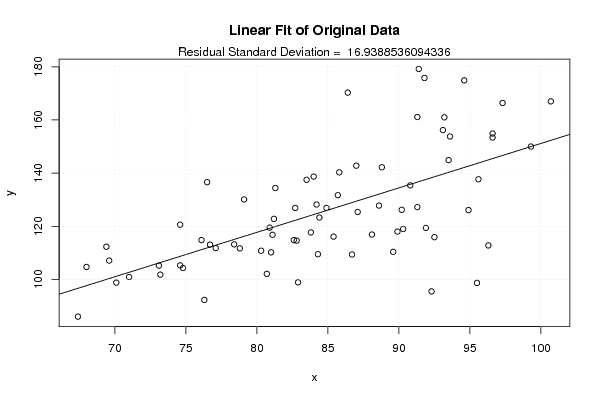
Residual SD (orginial)16.9388536094336
Residual SD (transformed)16.9144640951199

\begin{tabular}{lllllllll}
\hline
Box-Cox Linearity Plot \tabularnewline
# observations x & 73 \tabularnewline
maximum correlation & 0.633348496466385 \tabularnewline
optimal lambda(x) & 2 \tabularnewline
Residual SD (orginial) & 16.9388536094336 \tabularnewline
Residual SD (transformed) & 16.9144640951199 \tabularnewline
\hline
\end{tabular}
%Source: https://freestatistics.org/blog/index.php?pk=24340&T=1

[TABLE]
[ROW][C]Box-Cox Linearity Plot[/C][/ROW]
[ROW][C]# observations x[/C][C]73[/C][/ROW]
[ROW][C]maximum correlation[/C][C]0.633348496466385[/C][/ROW]
[ROW][C]optimal lambda(x)[/C][C]2[/C][/ROW]
[ROW][C]Residual SD (orginial)[/C][C]16.9388536094336[/C][/ROW]
[ROW][C]Residual SD (transformed)[/C][C]16.9144640951199[/C][/ROW]
[/TABLE]
Source: https://freestatistics.org/blog/index.php?pk=24340&T=1

Globally Unique Identifier (entire table): ba.freestatistics.org/blog/index.php?pk=24340&T=1

As an alternative you can also use a QR Code:  

The GUIDs for individual cells are displayed in the table below:

Box-Cox Linearity Plot
# observations x73
maximum correlation0.633348496466385
optimal lambda(x)2
Residual SD (orginial)16.9388536094336
Residual SD (transformed)16.9144640951199


Parameters (Session):
Parameters (R input):
R code (references can be found in the software module):
n <- length(x)
c <- array(NA,dim=c(401))
l <- array(NA,dim=c(401))
mx <- 0
mxli <- -999
for (i in 1:401)
{
l[i] <- (i-201)/100
if (l[i] != 0)
{
x1 <- (x^l[i] - 1) / l[i]
} else {
x1 <- log(x)
}
c[i] <- cor(x1,y)
if (mx < abs(c[i]))
{
mx <- abs(c[i])
mxli <- l[i]
}
}
c
mx
mxli
if (mxli != 0)
{
x1 <- (x^mxli - 1) / mxli
} else {
x1 <- log(x)
}
r<-lm(y~x)
se <- sqrt(var(r$residuals))
r1 <- lm(y~x1)
se1 <- sqrt(var(r1$residuals))
bitmap(file='test1.png')
plot(l,c,main='Box-Cox Linearity Plot',xlab='Lambda',ylab='correlation')
grid()
dev.off()
bitmap(file='test2.png')
plot(x,y,main='Linear Fit of Original Data',xlab='x',ylab='y')
abline(r)
grid()
mtext(paste('Residual Standard Deviation = ',se))
dev.off()
bitmap(file='test3.png')
plot(x1,y,main='Linear Fit of Transformed Data',xlab='x',ylab='y')
abline(r1)
grid()
mtext(paste('Residual Standard Deviation = ',se1))
dev.off()
load(file='createtable')
a<-table.start()
a<-table.row.start(a)
a<-table.element(a,'Box-Cox Linearity Plot',2,TRUE)
a<-table.row.end(a)
a<-table.row.start(a)
a<-table.element(a,'# observations x',header=TRUE)
a<-table.element(a,n)
a<-table.row.end(a)
a<-table.row.start(a)
a<-table.element(a,'maximum correlation',header=TRUE)
a<-table.element(a,mx)
a<-table.row.end(a)
a<-table.row.start(a)
a<-table.element(a,'optimal lambda(x)',header=TRUE)
a<-table.element(a,mxli)
a<-table.row.end(a)
a<-table.row.start(a)
a<-table.element(a,'Residual SD (orginial)',header=TRUE)
a<-table.element(a,se)
a<-table.row.end(a)
a<-table.row.start(a)
a<-table.element(a,'Residual SD (transformed)',header=TRUE)
a<-table.element(a,se1)
a<-table.row.end(a)
a<-table.end(a)
table.save(a,file='mytable.tab')