Free Statistics
of Irreproducible Research!
Description of Statistical Computation | |||||||||||||||||||||||||||||||||||||||||||||
|---|---|---|---|---|---|---|---|---|---|---|---|---|---|---|---|---|---|---|---|---|---|---|---|---|---|---|---|---|---|---|---|---|---|---|---|---|---|---|---|---|---|---|---|---|---|
| Author's title | |||||||||||||||||||||||||||||||||||||||||||||
| Author | *Unverified author* | ||||||||||||||||||||||||||||||||||||||||||||
| R Software Module | rwasp_bidensity.wasp | ||||||||||||||||||||||||||||||||||||||||||||
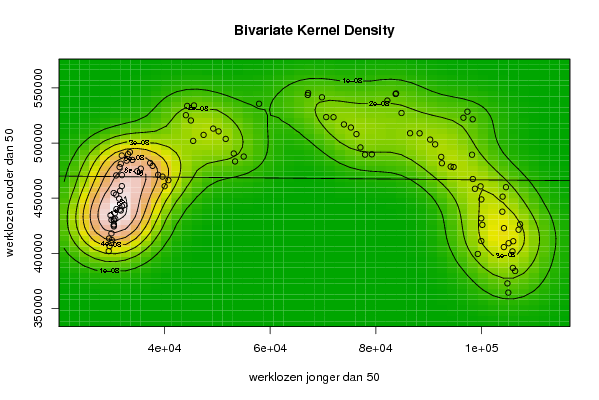
| Title produced by software | Bivariate Kernel Density Estimation | ||||||||||||||||||||||||||||||||||||||||||||
| Date of computation | Wed, 12 Nov 2008 10:59:56 -0700 | ||||||||||||||||||||||||||||||||||||||||||||
| Cite this page as follows | Statistical Computations at FreeStatistics.org, Office for Research Development and Education, URL https://freestatistics.org/blog/index.php?v=date/2008/Nov/12/t1226513293fp3aa25sbdjz0ly.htm/, Retrieved Sun, 19 May 2024 10:06:10 +0000 | ||||||||||||||||||||||||||||||||||||||||||||
| Statistical Computations at FreeStatistics.org, Office for Research Development and Education, URL https://freestatistics.org/blog/index.php?pk=24338, Retrieved Sun, 19 May 2024 10:06:10 +0000 | |||||||||||||||||||||||||||||||||||||||||||||
| QR Codes: | |||||||||||||||||||||||||||||||||||||||||||||
|
| |||||||||||||||||||||||||||||||||||||||||||||
| Original text written by user: | |||||||||||||||||||||||||||||||||||||||||||||
| IsPrivate? | No (this computation is public) | ||||||||||||||||||||||||||||||||||||||||||||
| User-defined keywords | Severijns Britt | ||||||||||||||||||||||||||||||||||||||||||||
| Estimated Impact | 170 | ||||||||||||||||||||||||||||||||||||||||||||
Tree of Dependent Computations | |||||||||||||||||||||||||||||||||||||||||||||
| Family? (F = Feedback message, R = changed R code, M = changed R Module, P = changed Parameters, D = changed Data) | |||||||||||||||||||||||||||||||||||||||||||||
| - [Bivariate Kernel Density Estimation] [Variuos EDA topic...] [2008-11-09 13:17:45] [3548296885df7a66ea8efc200c4aca50] - D [Bivariate Kernel Density Estimation] [various EDA topic...] [2008-11-12 17:59:56] [78308c9f3efc33d1da821bcd963df161] [Current] | |||||||||||||||||||||||||||||||||||||||||||||
| Feedback Forum | |||||||||||||||||||||||||||||||||||||||||||||
Post a new message | |||||||||||||||||||||||||||||||||||||||||||||
Dataset | |||||||||||||||||||||||||||||||||||||||||||||
| Dataseries X: | |||||||||||||||||||||||||||||||||||||||||||||
31899 31384 30650 30400 30003 29896 31557 31883 30830 30354 29756 29934 30599 30378 29925 29471 29567 29419 30796 31475 31708 31917 30871 31512 32362 31928 31699 30363 30386 30364 32806 33423 33071 33888 34805 35489 37259 37722 38764 39594 40004 40715 44028 45564 44277 44976 45406 47379 49200 50221 51573 53091 53337 54978 57885 67099 67169 69796 70600 71982 73957 75273 76322 77078 77954 79238 82179 83834 83744 84861 86478 88290 90287 91230 92380 92506 94172 94728 96581 97344 98346 98214 98366 98768 99832 99976 99961 100164 99964 99304 104008 104644 103950 104263 104241 105141 106018 105866 105944 106379 105082 104915 107026 107306 | |||||||||||||||||||||||||||||||||||||||||||||
| Dataseries Y: | |||||||||||||||||||||||||||||||||||||||||||||
460966 449577 431285 426208 411974 409252 456623 488681 470662 454671 434440 430236 436438 429692 418063 413396 406520 401909 453219 478198 481219 470914 440113 439555 443687 442677 438740 430888 424338 425262 484041 491769 489904 484697 474434 476749 481905 479287 471169 469533 460853 466256 525295 534150 533715 520488 501938 507409 513125 510633 503759 490508 483325 487744 535645 543664 545444 541528 523567 523472 516908 514106 508106 496022 489502 489790 538556 545050 544488 527256 508926 508851 503121 498842 487419 481699 478603 478214 522986 528465 521570 489411 467376 458506 460744 448878 431712 425755 411074 399358 451354 459947 437707 422807 405605 409117 410904 401695 386678 383864 364275 372665 421353 426284 | |||||||||||||||||||||||||||||||||||||||||||||
Tables (Output of Computation) | |||||||||||||||||||||||||||||||||||||||||||||
| |||||||||||||||||||||||||||||||||||||||||||||
Figures (Output of Computation) | |||||||||||||||||||||||||||||||||||||||||||||
Input Parameters & R Code | |||||||||||||||||||||||||||||||||||||||||||||
| Parameters (Session): | |||||||||||||||||||||||||||||||||||||||||||||
| par1 = 50 ; par2 = 50 ; par3 = 0 ; par4 = 0 ; par5 = 0 ; par6 = Y ; par7 = Y ; | |||||||||||||||||||||||||||||||||||||||||||||
| Parameters (R input): | |||||||||||||||||||||||||||||||||||||||||||||
| par1 = 50 ; par2 = 50 ; par3 = 0 ; par4 = 0 ; par5 = 0 ; par6 = Y ; par7 = Y ; | |||||||||||||||||||||||||||||||||||||||||||||
| R code (references can be found in the software module): | |||||||||||||||||||||||||||||||||||||||||||||
par1 <- as(par1,'numeric') | |||||||||||||||||||||||||||||||||||||||||||||