Free Statistics

of Irreproducible Research!

Author's title

Author*The author of this computation has been verified*
R Software Modulerwasp_boxcoxlin.wasp
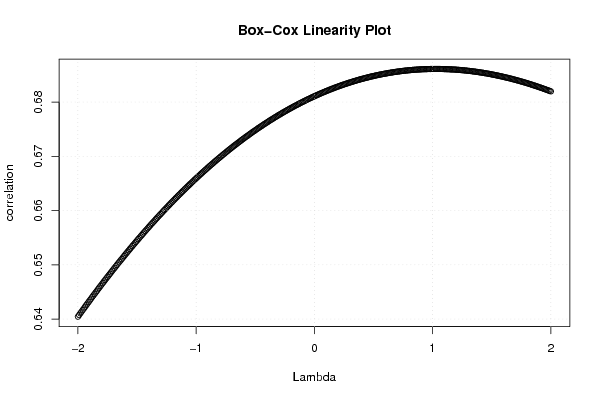
Title produced by softwareBox-Cox Linearity Plot
Date of computationWed, 12 Nov 2008 11:06:24 -0700
Cite this page as followsStatistical Computations at FreeStatistics.org, Office for Research Development and Education, URL https://freestatistics.org/blog/index.php?v=date/2008/Nov/12/t1226513225rw14ife1cqld0mn.htm/, Retrieved Sun, 19 May 2024 11:16:25 +0000
Statistical Computations at FreeStatistics.org, Office for Research Development and Education, URL https://freestatistics.org/blog/index.php?pk=24335, Retrieved Sun, 19 May 2024 11:16:25 +0000
QR Codes:

Original text written by user:
IsPrivate?No (this computation is public)
User-defined keywords
Estimated Impact148
Family? (F = Feedback message, R = changed R code, M = changed R Module, P = changed Parameters, D = changed Data)
F       [Box-Cox Linearity Plot] [tijdreeksQ3] [2008-11-12 18:06:24] [89a49ebb3ece8e9a225c7f9f53a14c57] [Current]
Feedback Forum
2008-11-20 10:30:53 [7bf28d4d60530086dbc44ae6b648927e] [reply
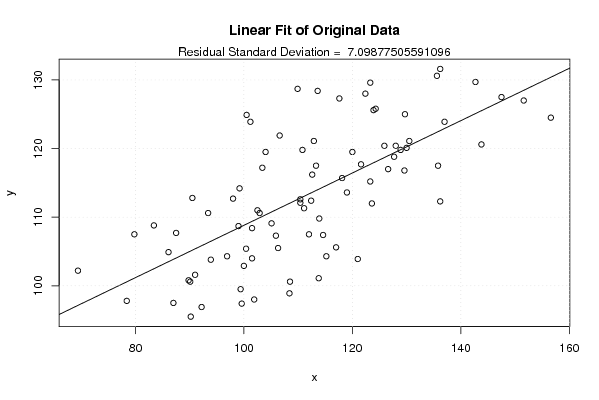
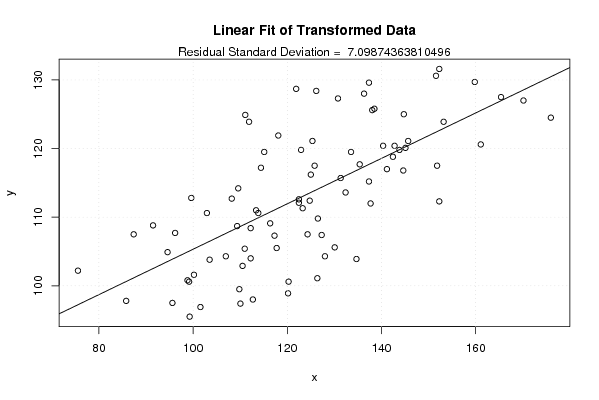
We proberen met deze transformatie de x variable te transformeren zodat de scatterplot meer lineair wordt. Als je kijkt naar de correlatie voor de transformatie is deze 0.6846. Als je de transformatie doorvoert bekom je een correlatie van 0.6861. Zoals de student vermeld heeft kunnen we besluiten dat de transformatie het verband niet verbetert.
2008-11-20 13:20:07 [6066575aa30c0611e452e930b1dff53d] [reply
Het is een redelijk volledig antwoord. De optimale lambda bedraagt niet 1 maar wel 1,03 (dit staat in de tabel). Verder zien we duidelijk dat het gaat om een stijgende lijn. Bovendien kunnen we, zoals men vermeld heeft, besluiten dat het toepassen van de transformatie de correlatie zeer weinig verhoogt,de correlatie blijft nagenoeg dezelfde.
2008-11-20 13:46:59 [Alexander Hendrickx] [reply
Zoals de student zegt zal de transformatie weinig of geen invloed hebben op de correlatie. De vraag werd goed en volledig beantwoord
2008-11-21 11:37:25 [Natalie De Wilde] [reply
Ik denk dat de transformatie de output wel verbetert, maar ik ben niet zeker. Als je een maximum bereikt dan heb je de beste transformatie gevonden. Jou parabool bereikt een maximum. Op de linear fit grafiek is er inderdaad wel weinig verandering te zien.
2008-11-21 14:00:58 [Thomas Plasschaert] [reply
goede oplossing, de box cox transformatie zorgt ervoor dat de gegevens een beter fit krijgen, voor deze transformatie hebben we echter een transformatiecoëfficiënt nodig, nl lambda. De optimale waarde voor lambda kunnen we aflezen uit de grafiek en dit waar de grafiek zijn maximum bereikt. De transformatie heeft echter niet zo'n grote invloed op de verschillende parameters.

Post a new message
Dataseries X:
78,4
114,6
113,3
117
99,6
99,4
101,9
115,2
108,5
113,8
121
92,2
90,2
101,5
126,6
93,9
89,8
93,4
101,5
110,4
105,9
108,4
113,9
86,1
69,4
101,2
100,5
98
106,6
90,1
96,9
125,9
112
100
123,9
79,8
83,4
113,6
112,9
104
109,9
99
106,3
128,9
111,1
102,9
130
87
87,5
117,6
103,4
110,8
112,6
102,5
112,4
135,6
105,1
127,7
137
91
90,5
122,4
123,3
124,3
120
118,1
119
142,7
123,6
129,6
151,6
110,4
99,2
130,5
136,2
129,7
128
121,6
135,8
143,8
147,5
136,2
156,6
123,3
100,4
Dataseries Y:
97,8
107,4
117,5
105,6
97,4
99,5
98
104,3
100,6
101,1
103,9
96,9
95,5
108,4
117
103,8
100,8
110,6
104
112,6
107,3
98,9
109,8
104,9
102,2
123,9
124,9
112,7
121,9
100,6
104,3
120,4
107,5
102,9
125,6
107,5
108,8
128,4
121,1
119,5
128,7
108,7
105,5
119,8
111,3
110,6
120,1
97,5
107,7
127,3
117,2
119,8
116,2
111
112,4
130,6
109,1
118,8
123,9
101,6
112,8
128
129,6
125,8
119,5
115,7
113,6
129,7
112
116,8
127
112,1
114,2
121,1
131,6
125
120,4
117,7
117,5
120,6
127,5
112,3
124,5
115,2
105,4


Summary of computational transaction
Raw Inputview raw input (R code)
Raw Outputview raw output of R engine
Computing time4 seconds
R Server'Herman Ole Andreas Wold' @ 193.190.124.10:1001

\begin{tabular}{lllllllll}
\hline
Summary of computational transaction \tabularnewline
Raw Input & view raw input (R code)  \tabularnewline
Raw Output & view raw output of R engine  \tabularnewline
Computing time & 4 seconds \tabularnewline
R Server & 'Herman Ole Andreas Wold' @ 193.190.124.10:1001 \tabularnewline
\hline
\end{tabular}
%Source: https://freestatistics.org/blog/index.php?pk=24335&T=0

[TABLE]
[ROW][C]Summary of computational transaction[/C][/ROW]
[ROW][C]Raw Input[/C][C]view raw input (R code) [/C][/ROW]
[ROW][C]Raw Output[/C][C]view raw output of R engine [/C][/ROW]
[ROW][C]Computing time[/C][C]4 seconds[/C][/ROW]
[ROW][C]R Server[/C][C]'Herman Ole Andreas Wold' @ 193.190.124.10:1001[/C][/ROW]
[/TABLE]
Source: https://freestatistics.org/blog/index.php?pk=24335&T=0

Globally Unique Identifier (entire table): ba.freestatistics.org/blog/index.php?pk=24335&T=0

As an alternative you can also use a QR Code:  

The GUIDs for individual cells are displayed in the table below:

Summary of computational transaction
Raw Inputview raw input (R code)
Raw Outputview raw output of R engine
Computing time4 seconds
R Server'Herman Ole Andreas Wold' @ 193.190.124.10:1001


Box-Cox Linearity Plot
# observations x85
maximum correlation0.686104039235149
optimal lambda(x)1.03
Residual SD (orginial)7.09877505591096
Residual SD (transformed)7.09874363810496

\begin{tabular}{lllllllll}
\hline
Box-Cox Linearity Plot \tabularnewline
# observations x & 85 \tabularnewline
maximum correlation & 0.686104039235149 \tabularnewline
optimal lambda(x) & 1.03 \tabularnewline
Residual SD (orginial) & 7.09877505591096 \tabularnewline
Residual SD (transformed) & 7.09874363810496 \tabularnewline
\hline
\end{tabular}
%Source: https://freestatistics.org/blog/index.php?pk=24335&T=1

[TABLE]
[ROW][C]Box-Cox Linearity Plot[/C][/ROW]
[ROW][C]# observations x[/C][C]85[/C][/ROW]
[ROW][C]maximum correlation[/C][C]0.686104039235149[/C][/ROW]
[ROW][C]optimal lambda(x)[/C][C]1.03[/C][/ROW]
[ROW][C]Residual SD (orginial)[/C][C]7.09877505591096[/C][/ROW]
[ROW][C]Residual SD (transformed)[/C][C]7.09874363810496[/C][/ROW]
[/TABLE]
Source: https://freestatistics.org/blog/index.php?pk=24335&T=1

Globally Unique Identifier (entire table): ba.freestatistics.org/blog/index.php?pk=24335&T=1

As an alternative you can also use a QR Code:  

The GUIDs for individual cells are displayed in the table below:

Box-Cox Linearity Plot
# observations x85
maximum correlation0.686104039235149
optimal lambda(x)1.03
Residual SD (orginial)7.09877505591096
Residual SD (transformed)7.09874363810496


Parameters (Session):
Parameters (R input):
R code (references can be found in the software module):
n <- length(x)
c <- array(NA,dim=c(401))
l <- array(NA,dim=c(401))
mx <- 0
mxli <- -999
for (i in 1:401)
{
l[i] <- (i-201)/100
if (l[i] != 0)
{
x1 <- (x^l[i] - 1) / l[i]
} else {
x1 <- log(x)
}
c[i] <- cor(x1,y)
if (mx < abs(c[i]))
{
mx <- abs(c[i])
mxli <- l[i]
}
}
c
mx
mxli
if (mxli != 0)
{
x1 <- (x^mxli - 1) / mxli
} else {
x1 <- log(x)
}
r<-lm(y~x)
se <- sqrt(var(r$residuals))
r1 <- lm(y~x1)
se1 <- sqrt(var(r1$residuals))
bitmap(file='test1.png')
plot(l,c,main='Box-Cox Linearity Plot',xlab='Lambda',ylab='correlation')
grid()
dev.off()
bitmap(file='test2.png')
plot(x,y,main='Linear Fit of Original Data',xlab='x',ylab='y')
abline(r)
grid()
mtext(paste('Residual Standard Deviation = ',se))
dev.off()
bitmap(file='test3.png')
plot(x1,y,main='Linear Fit of Transformed Data',xlab='x',ylab='y')
abline(r1)
grid()
mtext(paste('Residual Standard Deviation = ',se1))
dev.off()
load(file='createtable')
a<-table.start()
a<-table.row.start(a)
a<-table.element(a,'Box-Cox Linearity Plot',2,TRUE)
a<-table.row.end(a)
a<-table.row.start(a)
a<-table.element(a,'# observations x',header=TRUE)
a<-table.element(a,n)
a<-table.row.end(a)
a<-table.row.start(a)
a<-table.element(a,'maximum correlation',header=TRUE)
a<-table.element(a,mx)
a<-table.row.end(a)
a<-table.row.start(a)
a<-table.element(a,'optimal lambda(x)',header=TRUE)
a<-table.element(a,mxli)
a<-table.row.end(a)
a<-table.row.start(a)
a<-table.element(a,'Residual SD (orginial)',header=TRUE)
a<-table.element(a,se)
a<-table.row.end(a)
a<-table.row.start(a)
a<-table.element(a,'Residual SD (transformed)',header=TRUE)
a<-table.element(a,se1)
a<-table.row.end(a)
a<-table.end(a)
table.save(a,file='mytable.tab')