Free Statistics

of Irreproducible Research!

Author's title

Author*The author of this computation has been verified*
R Software Modulerwasp_cloud.wasp
Title produced by softwareTrivariate Scatterplots
Date of computationWed, 12 Nov 2008 11:02:05 -0700
Cite this page as followsStatistical Computations at FreeStatistics.org, Office for Research Development and Education, URL https://freestatistics.org/blog/index.php?v=date/2008/Nov/12/t1226513029n127zrmizpvqq4h.htm/, Retrieved Tue, 28 May 2024 01:45:36 +0000
Statistical Computations at FreeStatistics.org, Office for Research Development and Education, URL https://freestatistics.org/blog/index.php?pk=24334, Retrieved Tue, 28 May 2024 01:45:36 +0000
QR Codes:

Original text written by user:
IsPrivate?No (this computation is public)
User-defined keywordsjenske_cole@hotmail.com
Estimated Impact180
Family? (F = Feedback message, R = changed R code, M = changed R Module, P = changed Parameters, D = changed Data)
F     [Trivariate Scatterplots] [Various EDA Topic...] [2008-11-12 13:47:25] [8094ad203a218aaca2d1cea2c78c2d6e]
F    D    [Trivariate Scatterplots] [opdracht3 blok8 q...] [2008-11-12 18:02:05] [120dfa2440e51a0cfc0f5296bc5d7460] [Current]
Feedback Forum
2008-11-15 11:40:56 [Jenske Cole] [reply
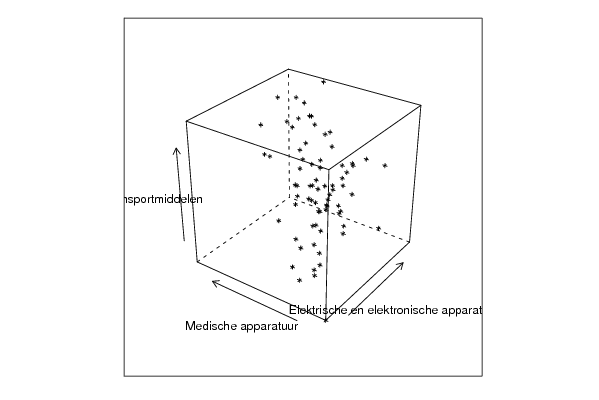
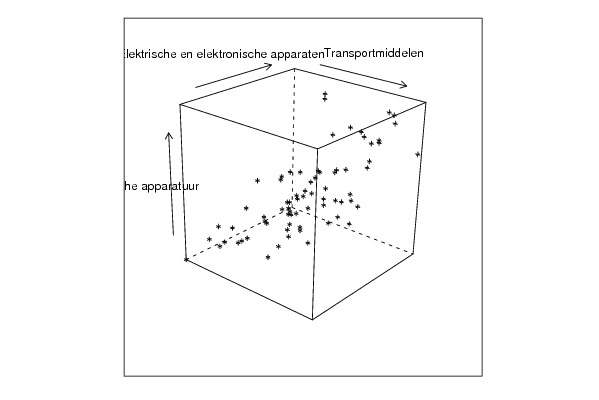
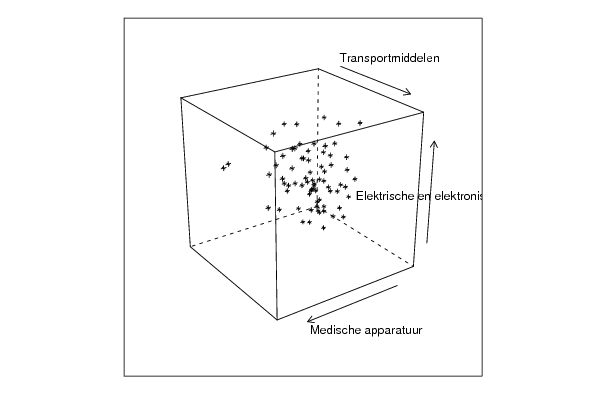
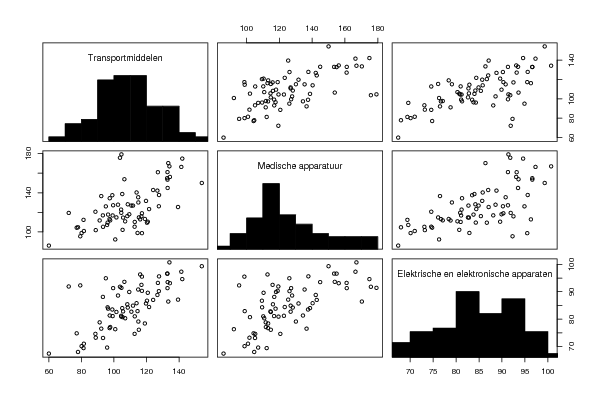
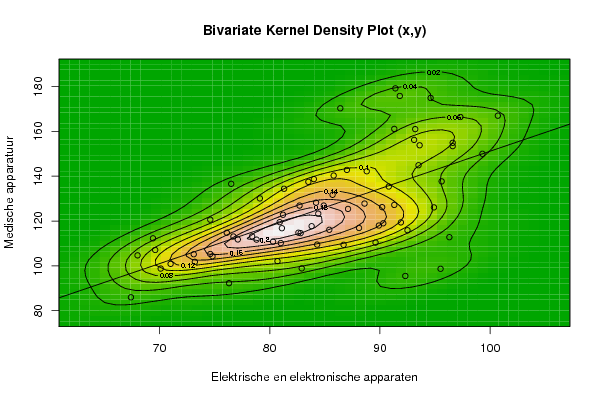
Bij de trivariate scatterplots zouden we het verband kunnen nagaan van 3variabelen tegelijkertijd, natuurlijk zullen we ons moeten beperken tot 2-dimensionele. Maar zo gaat er informatie verloren, naargelang rotatie kubus zijn er andere opmerkingen. Daarvoor hebben we een oplossing namelijk de gestandiseerde voorstelling, elke combinatie gescatterplot. Je neemt punten die bij elkaar liggen, je weet dan nog niet zeker of ze gelijkaardig zijn want je weet de dimensie niet. Je zou wel kunnen zeggen dat er bij alle variabelen een positief lineair verband is.
  2008-11-15 12:09:26 [58d427c57bd46519a715a3a7fea6a80f] [reply
Deze uitleg was onvolledig/onjuist.
2008-11-15 12:08:34 [Jenske Cole] [reply
Bij de trivariate scatterplots zouden we het verband kunnen nagaan van 3variabelen tegelijkertijd, natuurlijk zullen we ons moeten beperken tot 2-dimensionele. Maar zo gaat er informatie verloren, naargelang rotatie kubus zijn er andere opmerkingen. Daarvoor hebben we een oplossing namelijk de gestandiseerde voorstelling, elke combinatie gescatterplot. Je neemt punten die bij elkaar liggen, je weet dan nog niet zeker of ze gelijkaardig zijn want je weet de dimensie niet.
Nadelen:
- via deze R modules is het niet mogelijk om veel verschillende gegevensreeksen te vergelijken. Bij de Bivariate Density is er slechts een vergelijking van 2 gegevensreeksen mogelijk, bij de Partial Correlation en Trivariate Scatterplot zijn er 3 mogelijk.
- De Partial Correlation wordt niet grafisch weergegeven, er is enkel een tabel die de gegevens illustreert.
- Een ander probleem dat zou kunnen ontstaan is dat er bij de Bivariate Density maar waarden kunnen gebruikt worden die maximum 500 bedragen.
Voordelen:
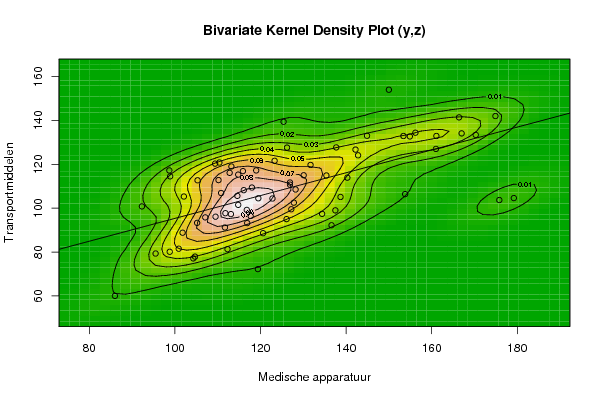
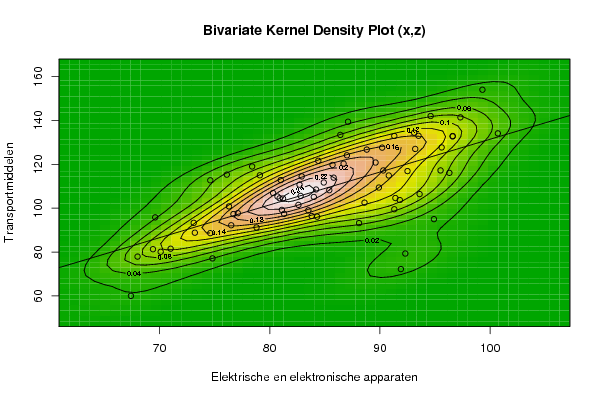
- Bivariate Density geeft duidelijke verbanden weer tussen 2 variabelen.
- Trivariate Scatterplot geeft een duidelijk verband weer tussen 3 variabelen.
- V ia de Trivariate Scatterplot wordt weergegeven hoe de 3-dimensionele scatterplot gerelateerd is aan de 2-dimensionle scatterplot en density plot.
2008-11-17 08:50:26 [Bert Moons] [reply
Bij trivariate scaterplots spreekt men denk ik niet van afhankelijke en onafhankelijke variabelen. Men kan er enkel een mogelijk verband tussen 3 variabelen uit afleiden. De zijaanzichten laten toe om telkens tussen 2 van de variabelen de verbanden te zoeken De 2de kubus toont inderdaad de hoogste correlatie tussen 2 van de variabelen(transportmiddelen en medische appartuur).

Post a new message
Dataseries X:
92.3
95.5
92.5
89.6
84.3
76.3
80.7
96.3
81.0
82.9
90.3
74.8
70.1
86.7
86.4
89.9
88.1
78.8
81.1
85.4
82.6
80.3
81.2
68.0
67.4
91.3
94.9
82.8
88.6
73.1
76.7
93.2
84.9
83.8
93.5
91.9
69.6
87.0
90.2
82.7
91.4
74.6
76.1
87.1
78.4
81.3
99.3
71.0
73.2
95.6
84.0
90.8
93.6
80.9
84.4
97.3
83.5
88.8
100.7
69.4
74.6
96.6
96.6
93.1
91.8
85.7
79.1
91.3
84.2
85.8
94.6
77.1
76.5
Dataseries Y:
95.5
98.7
115.9
110.4
109.5
92.3
102.1
112.8
110.2
98.9
119.0
104.3
98.8
109.4
170.3
118.0
116.9
111.7
116.8
116.1
114.8
110.8
122.8
104.7
86.0
127.2
126.1
114.6
127.8
105.2
113.1
161.0
126.9
117.7
144.9
119.4
107.1
142.8
126.2
126.9
179.2
105.3
114.8
125.4
113.2
134.4
150.0
100.9
101.8
137.7
138.7
135.4
153.8
119.5
123.3
166.4
137.5
142.2
167.0
112.3
120.6
154.9
153.4
156.2
175.8
131.7
130.1
161.1
128.2
140.3
174.9
111.8
136.6
Dataseries Z:
79.3
117.2
116.9
120.8
96.1
100.8
105.3
116.1
112.8
114.5
117.2
77.1
80.1
120.3
133.4
109.4
93.2
91.2
99.2
108.2
101.5
106.9
104.4
77.9
60.0
99.5
95.0
105.6
102.5
93.3
97.3
127.0
111.7
96.4
133.0
72.2
95.8
124.1
127.6
110.7
104.6
112.7
115.3
139.4
119.0
97.4
154.0
81.5
88.8
127.7
105.1
114.9
106.4
104.5
121.6
141.4
99.0
126.7
134.1
81.3
88.6
132.7
132.9
134.4
103.7
119.7
115.0
132.9
108.5
113.9
142.0
97.7
92.2


Summary of computational transaction
Raw Inputview raw input (R code)
Raw Outputview raw output of R engine
Computing time6 seconds
R Server'Herman Ole Andreas Wold' @ 193.190.124.10:1001

\begin{tabular}{lllllllll}
\hline
Summary of computational transaction \tabularnewline
Raw Input & view raw input (R code)  \tabularnewline
Raw Output & view raw output of R engine  \tabularnewline
Computing time & 6 seconds \tabularnewline
R Server & 'Herman Ole Andreas Wold' @ 193.190.124.10:1001 \tabularnewline
\hline
\end{tabular}
%Source: https://freestatistics.org/blog/index.php?pk=24334&T=0

[TABLE]
[ROW][C]Summary of computational transaction[/C][/ROW]
[ROW][C]Raw Input[/C][C]view raw input (R code) [/C][/ROW]
[ROW][C]Raw Output[/C][C]view raw output of R engine [/C][/ROW]
[ROW][C]Computing time[/C][C]6 seconds[/C][/ROW]
[ROW][C]R Server[/C][C]'Herman Ole Andreas Wold' @ 193.190.124.10:1001[/C][/ROW]
[/TABLE]
Source: https://freestatistics.org/blog/index.php?pk=24334&T=0

Globally Unique Identifier (entire table): ba.freestatistics.org/blog/index.php?pk=24334&T=0

As an alternative you can also use a QR Code:  

The GUIDs for individual cells are displayed in the table below:

Summary of computational transaction
Raw Inputview raw input (R code)
Raw Outputview raw output of R engine
Computing time6 seconds
R Server'Herman Ole Andreas Wold' @ 193.190.124.10:1001


Parameters (Session):
par1 = 50 ; par2 = 50 ; par3 = Y ; par4 = Y ; par5 = Elektrische en elektronische apparaten ; par6 = Medische apparatuur ; par7 = Transportmiddelen ;
Parameters (R input):
par1 = 50 ; par2 = 50 ; par3 = Y ; par4 = Y ; par5 = Elektrische en elektronische apparaten ; par6 = Medische apparatuur ; par7 = Transportmiddelen ;
R code (references can be found in the software module):
x <- array(x,dim=c(length(x),1))
colnames(x) <- par5
y <- array(y,dim=c(length(y),1))
colnames(y) <- par6
z <- array(z,dim=c(length(z),1))
colnames(z) <- par7
d <- data.frame(cbind(z,y,x))
colnames(d) <- list(par7,par6,par5)
par1 <- as.numeric(par1)
par2 <- as.numeric(par2)
if (par1>500) par1 <- 500
if (par2>500) par2 <- 500
if (par1<10) par1 <- 10
if (par2<10) par2 <- 10
library(GenKern)
library(lattice)
panel.hist <- function(x, ...)
{
usr <- par('usr'); on.exit(par(usr))
par(usr = c(usr[1:2], 0, 1.5) )
h <- hist(x, plot = FALSE)
breaks <- h$breaks; nB <- length(breaks)
y <- h$counts; y <- y/max(y)
rect(breaks[-nB], 0, breaks[-1], y, col='black', ...)
}
bitmap(file='cloud1.png')
cloud(z~x*y, screen = list(x=-45, y=45, z=35),xlab=par5,ylab=par6,zlab=par7)
dev.off()
bitmap(file='cloud2.png')
cloud(z~x*y, screen = list(x=35, y=45, z=25),xlab=par5,ylab=par6,zlab=par7)
dev.off()
bitmap(file='cloud3.png')
cloud(z~x*y, screen = list(x=35, y=-25, z=90),xlab=par5,ylab=par6,zlab=par7)
dev.off()
bitmap(file='pairs.png')
pairs(d,diag.panel=panel.hist)
dev.off()
x <- as.vector(x)
y <- as.vector(y)
z <- as.vector(z)
bitmap(file='bidensity1.png')
op <- KernSur(x,y, xgridsize=par1, ygridsize=par2, correlation=cor(x,y), xbandwidth=dpik(x), ybandwidth=dpik(y))
image(op$xords, op$yords, op$zden, col=terrain.colors(100), axes=TRUE,main='Bivariate Kernel Density Plot (x,y)',xlab=par5,ylab=par6)
if (par3=='Y') contour(op$xords, op$yords, op$zden, add=TRUE)
if (par4=='Y') points(x,y)
(r<-lm(y ~ x))
abline(r)
box()
dev.off()
bitmap(file='bidensity2.png')
op <- KernSur(y,z, xgridsize=par1, ygridsize=par2, correlation=cor(y,z), xbandwidth=dpik(y), ybandwidth=dpik(z))
op
image(op$xords, op$yords, op$zden, col=terrain.colors(100), axes=TRUE,main='Bivariate Kernel Density Plot (y,z)',xlab=par6,ylab=par7)
if (par3=='Y') contour(op$xords, op$yords, op$zden, add=TRUE)
if (par4=='Y') points(y,z)
(r<-lm(z ~ y))
abline(r)
box()
dev.off()
bitmap(file='bidensity3.png')
op <- KernSur(x,z, xgridsize=par1, ygridsize=par2, correlation=cor(x,z), xbandwidth=dpik(x), ybandwidth=dpik(z))
op
image(op$xords, op$yords, op$zden, col=terrain.colors(100), axes=TRUE,main='Bivariate Kernel Density Plot (x,z)',xlab=par5,ylab=par7)
if (par3=='Y') contour(op$xords, op$yords, op$zden, add=TRUE)
if (par4=='Y') points(x,z)
(r<-lm(z ~ x))
abline(r)
box()
dev.off()