Free Statistics

of Irreproducible Research!

Author's title

Author*Unverified author*
R Software Modulerwasp_hierarchicalclustering.wasp
Title produced by softwareHierarchical Clustering
Date of computationWed, 12 Nov 2008 10:40:31 -0700
Cite this page as followsStatistical Computations at FreeStatistics.org, Office for Research Development and Education, URL https://freestatistics.org/blog/index.php?v=date/2008/Nov/12/t1226511655vr2ladmkjv0pjda.htm/, Retrieved Sun, 19 May 2024 10:45:56 +0000
Statistical Computations at FreeStatistics.org, Office for Research Development and Education, URL https://freestatistics.org/blog/index.php?pk=24319, Retrieved Sun, 19 May 2024 10:45:56 +0000
QR Codes:

Original text written by user:
IsPrivate?No (this computation is public)
User-defined keywords
Estimated Impact180
Family? (F = Feedback message, R = changed R code, M = changed R Module, P = changed Parameters, D = changed Data)
F       [Hierarchical Clustering] [kelly] [2008-11-12 17:40:31] [607bd9e9685911f7e343f7bc0bf7bdf9] [Current]
Feedback Forum
2008-11-15 13:58:17 [Hundra Smet] [reply
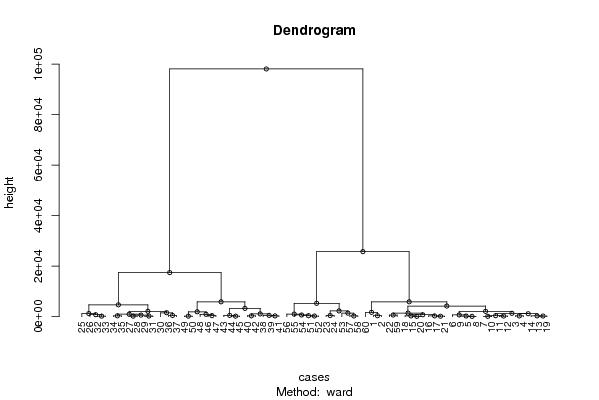
juist dendrogram, geen uitleg.

het nut van een dendrogram is dat we kunnen zien welke gegevens in 1 groep zitten en welke we dus anders moeten behandelen.

de periodes onder de linkertak zijn gelijkaardig => gegevens tot gegeven 41 (Xas) zitten in de linkercluster. de overige in de rechter. hieruit kunnen we afleiden dat er een opsplitsing moet worden gemaakt bij de behandeling van de verschillende gegevens.
2008-11-20 10:17:52 [Hannes Van Hoof] [reply
Het dendogram is juist gemaakt, er staat wel geen uitleg bijgegeven.
De tijdsreeksen worden opgesplitst in 2 takken, de perioden onder elke tak zijn gelijkaardig en worden verder onderverdeeldt. Hier is het zo dat onder de linkse tak de meeste periodes van 30 tot 40 liggen. onder de rechtse tak vooral de eerste periodes en de laatste.
2008-11-24 21:01:35 [Jonas Scheltjens] [reply
Q2: Als men de gegevens juist invoert verkrijgt men hier een dendrogram. De student in kwestie heeft deze ook verkregen, maar heeft er echter verder geen uitleg bij geschreven. Deze voorstelling geeft heel goed weer waar de clusters (of gegevens waarvan men enige samenhang en overeenkomsten kan bespeuren) zich bevinden. Bij het dendrogram worden allereerst de tijdsreeksen opgesplitst in 2 delen, waarvan de periodes gelijkaardig zijn (bijvoorbeeld: de volgnummers van de perioden zijn laag, de eerste maanden in de eerste cluster,…). Hierna worden de clusters verder en verder opgesplitst in kleinere clusters waarvan de elementen nog specifieker overeenkomen, en dit gaat zo verder totdat elke tak van de clusters nog slechts 1 element bevat.

Post a new message
Dataseries X:
2174,56	10205,29	9762,12
2196,72	10295,98	10124,63
2350,44	10892,76	10540,05
2440,25	10631,92	10601,61
2408,64	11441,08	10323,73
2472,81	11950,95	10418,4
2407,6	11037,54	10092,96
2454,62	11527,72	10364,91
2448,05	11383,89	10152,09
2497,84	10989,34	10032,8
2645,64	11079,42	10204,59
2756,76	11028,93	10001,6
2849,27	10973	10411,75
2921,44	11068,05	10673,38
2981,85	11394,84	10539,51
3080,58	11545,71	10723,78
3106,22	11809,38	10682,06
3119,31	11395,64	10283,19
3061,26	11082,38	10377,18
3097,31	11402,75	10486,64
3161,69	11716,87	10545,38
3257,16	12204,98	10554,27
3277,01	12986,62	10532,54
3295,32	13392,79	10324,31
3363,99	14368,05	10695,25
3494,17	15650,83	10827,81
3667,03	16102,64	10872,48
3813,06	16187,64	10971,19
3917,96	16311,54	11145,65
3895,51	17232,97	11234,68
3801,06	16397,83	11333,88
3570,12	14990,31	10997,97
3701,61	15147,55	11036,89
3862,27	15786,78	11257,35
3970,1	15934,09	11533,59
4138,52	16519,44	11963,12
4199,75	16101,07	12185,15
4290,89	16775,08	12377,62
4443,91	17286,32	12512,89
4502,64	17741,23	12631,48
4356,98	17128,37	12268,53
4591,27	17460,53	12754,8
4696,96	17611,14	13407,75
4621,4	18001,37	13480,21
4562,84	17974,77	13673,28
4202,52	16460,95	13239,71
4296,49	16235,39	13557,69
4435,23	16903,36	13901,28
4105,18	15543,76	13200,58
4116,68	15532,18	13406,97
3844,49	13731,31	12538,12
3720,98	13547,84	12419,57
3674,4	12602,93	12193,88
3857,62	13357,7	12656,63
3801,06	13995,33	12812,48
3504,37	14084,6	12056,67
3032,6	13168,91	11322,38
3047,03	12989,35	11530,75
2962,34	12123,53	11114,08
2197,82	9117,03	9181,73


Summary of computational transaction
Raw Inputview raw input (R code)
Raw Outputview raw output of R engine
Computing time2 seconds
R Server'Sir Ronald Aylmer Fisher' @ 193.190.124.24

\begin{tabular}{lllllllll}
\hline
Summary of computational transaction \tabularnewline
Raw Input & view raw input (R code)  \tabularnewline
Raw Output & view raw output of R engine  \tabularnewline
Computing time & 2 seconds \tabularnewline
R Server & 'Sir Ronald Aylmer Fisher' @ 193.190.124.24 \tabularnewline
\hline
\end{tabular}
%Source: https://freestatistics.org/blog/index.php?pk=24319&T=0

[TABLE]
[ROW][C]Summary of computational transaction[/C][/ROW]
[ROW][C]Raw Input[/C][C]view raw input (R code) [/C][/ROW]
[ROW][C]Raw Output[/C][C]view raw output of R engine [/C][/ROW]
[ROW][C]Computing time[/C][C]2 seconds[/C][/ROW]
[ROW][C]R Server[/C][C]'Sir Ronald Aylmer Fisher' @ 193.190.124.24[/C][/ROW]
[/TABLE]
Source: https://freestatistics.org/blog/index.php?pk=24319&T=0

Globally Unique Identifier (entire table): ba.freestatistics.org/blog/index.php?pk=24319&T=0

As an alternative you can also use a QR Code:  

The GUIDs for individual cells are displayed in the table below:

Summary of computational transaction
Raw Inputview raw input (R code)
Raw Outputview raw output of R engine
Computing time2 seconds
R Server'Sir Ronald Aylmer Fisher' @ 193.190.124.24


Summary of Dendrogram
LabelHeight
1106.378768558392
2118.683289472445
3127.235280484621
4174.116177881321
5195.687058846517
6203.501495080504
7207.034244751924
8208.635577263323
9236.858258458513
10237.785842724078
11241.036987618083
12250.93836593873
13259.279315981466
14275.441600706938
15282.653454427856
16287.996995940064
17294.210049683457
18303.672252601385
19319.148224654314
20329.93444805896
21331.113398400004
22374.338405456879
23389.676600442101
24399.936309411134
25401.02238703095
26456.803084381006
27477.577104455394
28514.725108854294
29516.199779427924
30606.908708329794
31637.918624120662
32658.745517901351
33696.832371319957
34756.788173469655
35776.740044100553
36928.360997119155
37981.593498255767
381015.59453965895
391091.08240388683
401163.97328717172
411220.55728786314
421317.77377905247
431383.29471641774
441406.61385960781
451545.64909760811
461704.02325663716
471932.16600476109
482095.33836685298
492115.19200970156
502277.8785138783
513283.95552711077
524205.36844125140
534682.33546425413
545285.75087017372
555874.36594951133
565884.24512073945
5717453.2983850913
5825751.9270848187
5998107.097261196

\begin{tabular}{lllllllll}
\hline
Summary of Dendrogram \tabularnewline
Label & Height \tabularnewline
1 & 106.378768558392 \tabularnewline
2 & 118.683289472445 \tabularnewline
3 & 127.235280484621 \tabularnewline
4 & 174.116177881321 \tabularnewline
5 & 195.687058846517 \tabularnewline
6 & 203.501495080504 \tabularnewline
7 & 207.034244751924 \tabularnewline
8 & 208.635577263323 \tabularnewline
9 & 236.858258458513 \tabularnewline
10 & 237.785842724078 \tabularnewline
11 & 241.036987618083 \tabularnewline
12 & 250.93836593873 \tabularnewline
13 & 259.279315981466 \tabularnewline
14 & 275.441600706938 \tabularnewline
15 & 282.653454427856 \tabularnewline
16 & 287.996995940064 \tabularnewline
17 & 294.210049683457 \tabularnewline
18 & 303.672252601385 \tabularnewline
19 & 319.148224654314 \tabularnewline
20 & 329.93444805896 \tabularnewline
21 & 331.113398400004 \tabularnewline
22 & 374.338405456879 \tabularnewline
23 & 389.676600442101 \tabularnewline
24 & 399.936309411134 \tabularnewline
25 & 401.02238703095 \tabularnewline
26 & 456.803084381006 \tabularnewline
27 & 477.577104455394 \tabularnewline
28 & 514.725108854294 \tabularnewline
29 & 516.199779427924 \tabularnewline
30 & 606.908708329794 \tabularnewline
31 & 637.918624120662 \tabularnewline
32 & 658.745517901351 \tabularnewline
33 & 696.832371319957 \tabularnewline
34 & 756.788173469655 \tabularnewline
35 & 776.740044100553 \tabularnewline
36 & 928.360997119155 \tabularnewline
37 & 981.593498255767 \tabularnewline
38 & 1015.59453965895 \tabularnewline
39 & 1091.08240388683 \tabularnewline
40 & 1163.97328717172 \tabularnewline
41 & 1220.55728786314 \tabularnewline
42 & 1317.77377905247 \tabularnewline
43 & 1383.29471641774 \tabularnewline
44 & 1406.61385960781 \tabularnewline
45 & 1545.64909760811 \tabularnewline
46 & 1704.02325663716 \tabularnewline
47 & 1932.16600476109 \tabularnewline
48 & 2095.33836685298 \tabularnewline
49 & 2115.19200970156 \tabularnewline
50 & 2277.8785138783 \tabularnewline
51 & 3283.95552711077 \tabularnewline
52 & 4205.36844125140 \tabularnewline
53 & 4682.33546425413 \tabularnewline
54 & 5285.75087017372 \tabularnewline
55 & 5874.36594951133 \tabularnewline
56 & 5884.24512073945 \tabularnewline
57 & 17453.2983850913 \tabularnewline
58 & 25751.9270848187 \tabularnewline
59 & 98107.097261196 \tabularnewline
\hline
\end{tabular}
%Source: https://freestatistics.org/blog/index.php?pk=24319&T=1

[TABLE]
[ROW][C]Summary of Dendrogram[/C][/ROW]
[ROW][C]Label[/C][C]Height[/C][/ROW]
[ROW][C]1[/C][C]106.378768558392[/C][/ROW]
[ROW][C]2[/C][C]118.683289472445[/C][/ROW]
[ROW][C]3[/C][C]127.235280484621[/C][/ROW]
[ROW][C]4[/C][C]174.116177881321[/C][/ROW]
[ROW][C]5[/C][C]195.687058846517[/C][/ROW]
[ROW][C]6[/C][C]203.501495080504[/C][/ROW]
[ROW][C]7[/C][C]207.034244751924[/C][/ROW]
[ROW][C]8[/C][C]208.635577263323[/C][/ROW]
[ROW][C]9[/C][C]236.858258458513[/C][/ROW]
[ROW][C]10[/C][C]237.785842724078[/C][/ROW]
[ROW][C]11[/C][C]241.036987618083[/C][/ROW]
[ROW][C]12[/C][C]250.93836593873[/C][/ROW]
[ROW][C]13[/C][C]259.279315981466[/C][/ROW]
[ROW][C]14[/C][C]275.441600706938[/C][/ROW]
[ROW][C]15[/C][C]282.653454427856[/C][/ROW]
[ROW][C]16[/C][C]287.996995940064[/C][/ROW]
[ROW][C]17[/C][C]294.210049683457[/C][/ROW]
[ROW][C]18[/C][C]303.672252601385[/C][/ROW]
[ROW][C]19[/C][C]319.148224654314[/C][/ROW]
[ROW][C]20[/C][C]329.93444805896[/C][/ROW]
[ROW][C]21[/C][C]331.113398400004[/C][/ROW]
[ROW][C]22[/C][C]374.338405456879[/C][/ROW]
[ROW][C]23[/C][C]389.676600442101[/C][/ROW]
[ROW][C]24[/C][C]399.936309411134[/C][/ROW]
[ROW][C]25[/C][C]401.02238703095[/C][/ROW]
[ROW][C]26[/C][C]456.803084381006[/C][/ROW]
[ROW][C]27[/C][C]477.577104455394[/C][/ROW]
[ROW][C]28[/C][C]514.725108854294[/C][/ROW]
[ROW][C]29[/C][C]516.199779427924[/C][/ROW]
[ROW][C]30[/C][C]606.908708329794[/C][/ROW]
[ROW][C]31[/C][C]637.918624120662[/C][/ROW]
[ROW][C]32[/C][C]658.745517901351[/C][/ROW]
[ROW][C]33[/C][C]696.832371319957[/C][/ROW]
[ROW][C]34[/C][C]756.788173469655[/C][/ROW]
[ROW][C]35[/C][C]776.740044100553[/C][/ROW]
[ROW][C]36[/C][C]928.360997119155[/C][/ROW]
[ROW][C]37[/C][C]981.593498255767[/C][/ROW]
[ROW][C]38[/C][C]1015.59453965895[/C][/ROW]
[ROW][C]39[/C][C]1091.08240388683[/C][/ROW]
[ROW][C]40[/C][C]1163.97328717172[/C][/ROW]
[ROW][C]41[/C][C]1220.55728786314[/C][/ROW]
[ROW][C]42[/C][C]1317.77377905247[/C][/ROW]
[ROW][C]43[/C][C]1383.29471641774[/C][/ROW]
[ROW][C]44[/C][C]1406.61385960781[/C][/ROW]
[ROW][C]45[/C][C]1545.64909760811[/C][/ROW]
[ROW][C]46[/C][C]1704.02325663716[/C][/ROW]
[ROW][C]47[/C][C]1932.16600476109[/C][/ROW]
[ROW][C]48[/C][C]2095.33836685298[/C][/ROW]
[ROW][C]49[/C][C]2115.19200970156[/C][/ROW]
[ROW][C]50[/C][C]2277.8785138783[/C][/ROW]
[ROW][C]51[/C][C]3283.95552711077[/C][/ROW]
[ROW][C]52[/C][C]4205.36844125140[/C][/ROW]
[ROW][C]53[/C][C]4682.33546425413[/C][/ROW]
[ROW][C]54[/C][C]5285.75087017372[/C][/ROW]
[ROW][C]55[/C][C]5874.36594951133[/C][/ROW]
[ROW][C]56[/C][C]5884.24512073945[/C][/ROW]
[ROW][C]57[/C][C]17453.2983850913[/C][/ROW]
[ROW][C]58[/C][C]25751.9270848187[/C][/ROW]
[ROW][C]59[/C][C]98107.097261196[/C][/ROW]
[/TABLE]
Source: https://freestatistics.org/blog/index.php?pk=24319&T=1

Globally Unique Identifier (entire table): ba.freestatistics.org/blog/index.php?pk=24319&T=1

As an alternative you can also use a QR Code:  

The GUIDs for individual cells are displayed in the table below:

Summary of Dendrogram
LabelHeight
1106.378768558392
2118.683289472445
3127.235280484621
4174.116177881321
5195.687058846517
6203.501495080504
7207.034244751924
8208.635577263323
9236.858258458513
10237.785842724078
11241.036987618083
12250.93836593873
13259.279315981466
14275.441600706938
15282.653454427856
16287.996995940064
17294.210049683457
18303.672252601385
19319.148224654314
20329.93444805896
21331.113398400004
22374.338405456879
23389.676600442101
24399.936309411134
25401.02238703095
26456.803084381006
27477.577104455394
28514.725108854294
29516.199779427924
30606.908708329794
31637.918624120662
32658.745517901351
33696.832371319957
34756.788173469655
35776.740044100553
36928.360997119155
37981.593498255767
381015.59453965895
391091.08240388683
401163.97328717172
411220.55728786314
421317.77377905247
431383.29471641774
441406.61385960781
451545.64909760811
461704.02325663716
471932.16600476109
482095.33836685298
492115.19200970156
502277.8785138783
513283.95552711077
524205.36844125140
534682.33546425413
545285.75087017372
555874.36594951133
565884.24512073945
5717453.2983850913
5825751.9270848187
5998107.097261196


Parameters (Session):
par1 = ward ; par2 = ALL ; par3 = FALSE ; par4 = FALSE ;
Parameters (R input):
par1 = ward ; par2 = ALL ; par3 = FALSE ; par4 = FALSE ;
R code (references can be found in the software module):
par3 <- as.logical(par3)
par4 <- as.logical(par4)
if (par3 == 'TRUE'){
dum = xlab
xlab = ylab
ylab = dum
}
x <- t(y)
hc <- hclust(dist(x),method=par1)
d <- as.dendrogram(hc)
str(d)
mysub <- paste('Method: ',par1)
bitmap(file='test1.png')
if (par4 == 'TRUE'){
plot(d,main=main,ylab=ylab,xlab=xlab,horiz=par3, nodePar=list(pch = c(1,NA), cex=0.8, lab.cex = 0.8),type='t',center=T, sub=mysub)
} else {
plot(d,main=main,ylab=ylab,xlab=xlab,horiz=par3, nodePar=list(pch = c(1,NA), cex=0.8, lab.cex = 0.8), sub=mysub)
}
dev.off()
if (par2 != 'ALL'){
if (par3 == 'TRUE'){
ylab = 'cluster'
} else {
xlab = 'cluster'
}
par2 <- as.numeric(par2)
memb <- cutree(hc, k = par2)
cent <- NULL
for(k in 1:par2){
cent <- rbind(cent, colMeans(x[memb == k, , drop = FALSE]))
}
hc1 <- hclust(dist(cent),method=par1, members = table(memb))
de <- as.dendrogram(hc1)
bitmap(file='test2.png')
if (par4 == 'TRUE'){
plot(de,main=main,ylab=ylab,xlab=xlab,horiz=par3, nodePar=list(pch = c(1,NA), cex=0.8, lab.cex = 0.8),type='t',center=T, sub=mysub)
} else {
plot(de,main=main,ylab=ylab,xlab=xlab,horiz=par3, nodePar=list(pch = c(1,NA), cex=0.8, lab.cex = 0.8), sub=mysub)
}
dev.off()
str(de)
}
load(file='createtable')
a<-table.start()
a<-table.row.start(a)
a<-table.element(a,'Summary of Dendrogram',2,TRUE)
a<-table.row.end(a)
a<-table.row.start(a)
a<-table.element(a,'Label',header=TRUE)
a<-table.element(a,'Height',header=TRUE)
a<-table.row.end(a)
num <- length(x[,1])-1
for (i in 1:num)
{
a<-table.row.start(a)
a<-table.element(a,hc$labels[i])
a<-table.element(a,hc$height[i])
a<-table.row.end(a)
}
a<-table.end(a)
table.save(a,file='mytable1.tab')
if (par2 != 'ALL'){
a<-table.start()
a<-table.row.start(a)
a<-table.element(a,'Summary of Cut Dendrogram',2,TRUE)
a<-table.row.end(a)
a<-table.row.start(a)
a<-table.element(a,'Label',header=TRUE)
a<-table.element(a,'Height',header=TRUE)
a<-table.row.end(a)
num <- par2-1
for (i in 1:num)
{
a<-table.row.start(a)
a<-table.element(a,i)
a<-table.element(a,hc1$height[i])
a<-table.row.end(a)
}
a<-table.end(a)
table.save(a,file='mytable2.tab')
}