Free Statistics

of Irreproducible Research!

Author's title

Author*Unverified author*
R Software Modulerwasp_hierarchicalclustering.wasp
Title produced by softwareHierarchical Clustering
Date of computationWed, 12 Nov 2008 09:10:34 -0700
Cite this page as followsStatistical Computations at FreeStatistics.org, Office for Research Development and Education, URL https://freestatistics.org/blog/index.php?v=date/2008/Nov/12/t1226506317gpmykxs3pmud6xt.htm/, Retrieved Sun, 19 May 2024 11:31:47 +0000
Statistical Computations at FreeStatistics.org, Office for Research Development and Education, URL https://freestatistics.org/blog/index.php?pk=24268, Retrieved Sun, 19 May 2024 11:31:47 +0000
QR Codes:

Original text written by user:
IsPrivate?No (this computation is public)
User-defined keywords
Estimated Impact155
Family? (F = Feedback message, R = changed R code, M = changed R Module, P = changed Parameters, D = changed Data)
-       [Hierarchical Clustering] [Various EDA topic...] [2008-11-12 16:10:34] [80e37024345c6a903bf645806b7fbe14] [Current]
Feedback Forum

Post a new message
Dataseries X:
3822,5	538,9	2828,3	4000,9	1609,3
4092,2	556,4	3083,6	4053,7	1577,5
3628,9	498	2855,1	3774	1493
4391,4	541	3058,3	4171,2	1741
4057,6	512,1	2871,7	3787,8	1709,3
4051,9	480,4	2849,7	3677,8	1698,8
3971,8	457,6	2833,2	3747,8	1756,5
3310,5	457,3	2341,3	2684,9	1280,5
3814,8	461,4	2713,5	3341,1	1576,5
3977,1	455,3	2959	3611,6	1682,1
3451,4	384	2489,2	3317,1	1536,7
2678,6	329,3	2378,3	3123,4	1478,6
3279,3	396,3	2404,6	3079,8	1487,6


Summary of computational transaction
Raw Inputview raw input (R code)
Raw Outputview raw output of R engine
Computing time2 seconds
R Server'Herman Ole Andreas Wold' @ 193.190.124.10:1001

\begin{tabular}{lllllllll}
\hline
Summary of computational transaction \tabularnewline
Raw Input & view raw input (R code)  \tabularnewline
Raw Output & view raw output of R engine  \tabularnewline
Computing time & 2 seconds \tabularnewline
R Server & 'Herman Ole Andreas Wold' @ 193.190.124.10:1001 \tabularnewline
\hline
\end{tabular}
%Source: https://freestatistics.org/blog/index.php?pk=24268&T=0

[TABLE]
[ROW][C]Summary of computational transaction[/C][/ROW]
[ROW][C]Raw Input[/C][C]view raw input (R code) [/C][/ROW]
[ROW][C]Raw Output[/C][C]view raw output of R engine [/C][/ROW]
[ROW][C]Computing time[/C][C]2 seconds[/C][/ROW]
[ROW][C]R Server[/C][C]'Herman Ole Andreas Wold' @ 193.190.124.10:1001[/C][/ROW]
[/TABLE]
Source: https://freestatistics.org/blog/index.php?pk=24268&T=0

Globally Unique Identifier (entire table): ba.freestatistics.org/blog/index.php?pk=24268&T=0

As an alternative you can also use a QR Code:  

The GUIDs for individual cells are displayed in the table below:

Summary of computational transaction
Raw Inputview raw input (R code)
Raw Outputview raw output of R engine
Computing time2 seconds
R Server'Herman Ole Andreas Wold' @ 193.190.124.10:1001


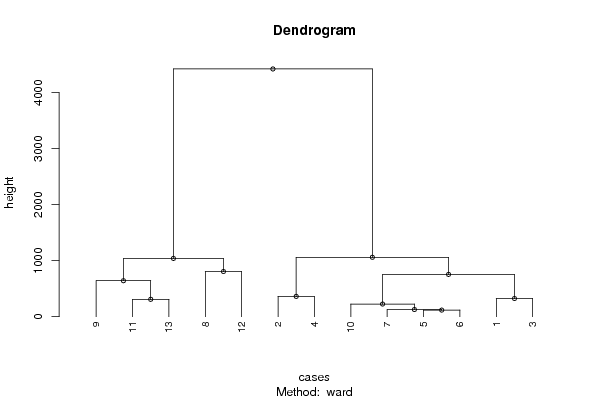
Summary of Dendrogram
LabelHeight
1117.182037872705
2127.149450902843
3225.20933634579
4309.271660518709
5323.853840489811
6361.851336877453
7641.331303853327
8753.748287071893
9805.342455108384
101039.15006475220
111059.32909543882
124421.15602362528

\begin{tabular}{lllllllll}
\hline
Summary of Dendrogram \tabularnewline
Label & Height \tabularnewline
1 & 117.182037872705 \tabularnewline
2 & 127.149450902843 \tabularnewline
3 & 225.20933634579 \tabularnewline
4 & 309.271660518709 \tabularnewline
5 & 323.853840489811 \tabularnewline
6 & 361.851336877453 \tabularnewline
7 & 641.331303853327 \tabularnewline
8 & 753.748287071893 \tabularnewline
9 & 805.342455108384 \tabularnewline
10 & 1039.15006475220 \tabularnewline
11 & 1059.32909543882 \tabularnewline
12 & 4421.15602362528 \tabularnewline
\hline
\end{tabular}
%Source: https://freestatistics.org/blog/index.php?pk=24268&T=1

[TABLE]
[ROW][C]Summary of Dendrogram[/C][/ROW]
[ROW][C]Label[/C][C]Height[/C][/ROW]
[ROW][C]1[/C][C]117.182037872705[/C][/ROW]
[ROW][C]2[/C][C]127.149450902843[/C][/ROW]
[ROW][C]3[/C][C]225.20933634579[/C][/ROW]
[ROW][C]4[/C][C]309.271660518709[/C][/ROW]
[ROW][C]5[/C][C]323.853840489811[/C][/ROW]
[ROW][C]6[/C][C]361.851336877453[/C][/ROW]
[ROW][C]7[/C][C]641.331303853327[/C][/ROW]
[ROW][C]8[/C][C]753.748287071893[/C][/ROW]
[ROW][C]9[/C][C]805.342455108384[/C][/ROW]
[ROW][C]10[/C][C]1039.15006475220[/C][/ROW]
[ROW][C]11[/C][C]1059.32909543882[/C][/ROW]
[ROW][C]12[/C][C]4421.15602362528[/C][/ROW]
[/TABLE]
Source: https://freestatistics.org/blog/index.php?pk=24268&T=1

Globally Unique Identifier (entire table): ba.freestatistics.org/blog/index.php?pk=24268&T=1

As an alternative you can also use a QR Code:  

The GUIDs for individual cells are displayed in the table below:

Summary of Dendrogram
LabelHeight
1117.182037872705
2127.149450902843
3225.20933634579
4309.271660518709
5323.853840489811
6361.851336877453
7641.331303853327
8753.748287071893
9805.342455108384
101039.15006475220
111059.32909543882
124421.15602362528


Parameters (Session):
par1 = ward ; par2 = ALL ; par3 = FALSE ; par4 = FALSE ;
Parameters (R input):
par1 = ward ; par2 = ALL ; par3 = FALSE ; par4 = FALSE ;
R code (references can be found in the software module):
par3 <- as.logical(par3)
par4 <- as.logical(par4)
if (par3 == 'TRUE'){
dum = xlab
xlab = ylab
ylab = dum
}
x <- t(y)
hc <- hclust(dist(x),method=par1)
d <- as.dendrogram(hc)
str(d)
mysub <- paste('Method: ',par1)
bitmap(file='test1.png')
if (par4 == 'TRUE'){
plot(d,main=main,ylab=ylab,xlab=xlab,horiz=par3, nodePar=list(pch = c(1,NA), cex=0.8, lab.cex = 0.8),type='t',center=T, sub=mysub)
} else {
plot(d,main=main,ylab=ylab,xlab=xlab,horiz=par3, nodePar=list(pch = c(1,NA), cex=0.8, lab.cex = 0.8), sub=mysub)
}
dev.off()
if (par2 != 'ALL'){
if (par3 == 'TRUE'){
ylab = 'cluster'
} else {
xlab = 'cluster'
}
par2 <- as.numeric(par2)
memb <- cutree(hc, k = par2)
cent <- NULL
for(k in 1:par2){
cent <- rbind(cent, colMeans(x[memb == k, , drop = FALSE]))
}
hc1 <- hclust(dist(cent),method=par1, members = table(memb))
de <- as.dendrogram(hc1)
bitmap(file='test2.png')
if (par4 == 'TRUE'){
plot(de,main=main,ylab=ylab,xlab=xlab,horiz=par3, nodePar=list(pch = c(1,NA), cex=0.8, lab.cex = 0.8),type='t',center=T, sub=mysub)
} else {
plot(de,main=main,ylab=ylab,xlab=xlab,horiz=par3, nodePar=list(pch = c(1,NA), cex=0.8, lab.cex = 0.8), sub=mysub)
}
dev.off()
str(de)
}
load(file='createtable')
a<-table.start()
a<-table.row.start(a)
a<-table.element(a,'Summary of Dendrogram',2,TRUE)
a<-table.row.end(a)
a<-table.row.start(a)
a<-table.element(a,'Label',header=TRUE)
a<-table.element(a,'Height',header=TRUE)
a<-table.row.end(a)
num <- length(x[,1])-1
for (i in 1:num)
{
a<-table.row.start(a)
a<-table.element(a,hc$labels[i])
a<-table.element(a,hc$height[i])
a<-table.row.end(a)
}
a<-table.end(a)
table.save(a,file='mytable1.tab')
if (par2 != 'ALL'){
a<-table.start()
a<-table.row.start(a)
a<-table.element(a,'Summary of Cut Dendrogram',2,TRUE)
a<-table.row.end(a)
a<-table.row.start(a)
a<-table.element(a,'Label',header=TRUE)
a<-table.element(a,'Height',header=TRUE)
a<-table.row.end(a)
num <- par2-1
for (i in 1:num)
{
a<-table.row.start(a)
a<-table.element(a,i)
a<-table.element(a,hc1$height[i])
a<-table.row.end(a)
}
a<-table.end(a)
table.save(a,file='mytable2.tab')
}