Free Statistics

of Irreproducible Research!

Author's title

Author*Unverified author*
R Software Modulerwasp_boxcoxlin.wasp
Title produced by softwareBox-Cox Linearity Plot
Date of computationWed, 12 Nov 2008 08:18:32 -0700
Cite this page as followsStatistical Computations at FreeStatistics.org, Office for Research Development and Education, URL https://freestatistics.org/blog/index.php?v=date/2008/Nov/12/t1226503176xipfw84ist0vfn2.htm/, Retrieved Sun, 19 May 2024 10:42:04 +0000
Statistical Computations at FreeStatistics.org, Office for Research Development and Education, URL https://freestatistics.org/blog/index.php?pk=24241, Retrieved Sun, 19 May 2024 10:42:04 +0000
QR Codes:

Original text written by user:
IsPrivate?No (this computation is public)
User-defined keywords
Estimated Impact152
Family? (F = Feedback message, R = changed R code, M = changed R Module, P = changed Parameters, D = changed Data)
F       [Box-Cox Linearity Plot] [Box-Cox Linearity...] [2008-11-12 15:18:32] [bca67c46bcf35400430db40e8c261de9] [Current]
Feedback Forum
2008-11-16 15:14:47 [Julie Govaerts] [reply
box-cox linearity plot --> er worden 2 variabelen voorgesteld dmv een scatterplot en dan gaan we kijken hoe lineair zij zijn.

Doel: De transformatie vinden van de X-variabele die de correlatie tussen Y en een X-variabele vervetert = meer lineair (transformatie moet nuttig zijn)

Wanneer men een lineaire fit van Y tegen X uitvoert, kan een degelijke transformatie van X de fit soms aanzienlijk verbeteren. De Box-Cox transformatie wordt gedefinieerd als:

λ (lambda) is de transformatieparameter die schommelt tussen -2 en 2 = wordt toegepast op X --> de optimale waarde van lambda zoeken (!kan ook soms niet de moeite zijn = niet veel verbeterd!)

De Box-Cox Linearity Plot is een plot van de correlatie tussen Y en de getransformeerde X voor gegeven waarden van λ. λ is het coördinaat van de variabele op de horizontale as. Het coördinaat van de verticale as is de waarde van de correlatie tussen Y en de getransformeerde X. De waarde van λ die correspondeert met de maximumcorrelatie is de optimale keuze

in dit geval is er niet veel verbeterd!
2008-11-16 16:18:02 [Kelly Deckx] [reply
Je hebt gelijk dat de transformatie niet verbeterd. de resultaten op de y-as schommelen tussen de 0.85 en de 0.90, de transformatie heeft dus bijna geen effect.
2008-11-20 08:46:14 [Bénédicte Soens] [reply
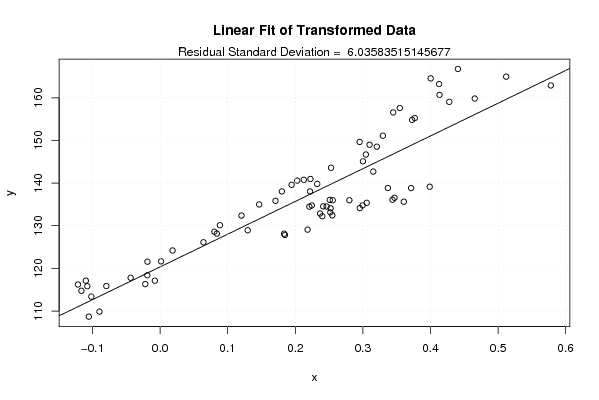
Bij deze methode brengen we 2 variabelen met elkaar in verband in een scatterplot en daar trekken we dan een rechte door, dit zorgt voor de vertoning van een wetmatigheid. De kromme die we in de box-cox linearity plot bekomen is het gevolg van de punten die in de data niet op de lijn liggen. We kunnen hier spreken van een parabool, waarbij de y-as de correlatie weergeeft en de x-as de lambda (die meestal tussen -2 en 2 ligt). Hier kunnen we zien dat de transformatie met een logaritme (te zien aan R-code) geen verandering te weeg brengt. Dit is duidelijk doordat de grafiek van de originele data sterk lijkt op deze van de getransformeerde data.

Post a new message
Dataseries X:
0,9059
0,8883
0,8924
0,8833
0,8700
0,8758
0,8858
0,9170
0,9554
0,9922
0,9778
0,9808
0,9811
1,0014
1,0183
1,0622
1,0773
1,0807
1,0848
1,1582
1,1663
1,1372
1,1139
1,1222
1,1692
1,1702
1,2286
1,2613
1,2646
1,2262
1,1985
1,2007
1,2138
1,2266
1,2176
1,2218
1,2490
1,2991
1,3408
1,3119
1,3014
1,3201
1,2938
1,2694
1,2165
1,2037
1,2292
1,2256
1,2015
1,1786
1,1856
1,2103
1,1938
1,2020
1,2271
1,2770
1,2650
1,2684
1,2811
1,2727
1,2611
1,2881
1,3213
1,2999
1,3074
1,3242
1,3516
1,3511
1,3419
1,3716
1,3622
1,3896
1,4227
1,4684
Dataseries Y:
109,86
108,68
113,38
117,12
116,23
114,75
115,81
115,86
117,80
117,11
116,31
118,38
121,57
121,65
124,20
126,12
128,60
128,16
130,12
135,83
138,05
134,99
132,38
128,94
128,12
127,84
132,43
134,13
134,78
133,13
129,08
134,48
132,86
134,08
134,54
134,51
135,97
136,09
139,14
135,63
136,55
138,83
138,84
135,37
132,22
134,75
135,98
136,06
138,05
139,59
140,58
139,81
140,77
140,96
143,59
142,70
145,11
146,70
148,53
148,99
149,65
151,11
154,82
156,56
157,60
155,24
160,68
163,22
164,55
166,76
159,05
159,82
164,95
162,89


Summary of computational transaction
Raw Inputview raw input (R code)
Raw Outputview raw output of R engine
Computing time1 seconds
R Server'Gwilym Jenkins' @ 72.249.127.135

\begin{tabular}{lllllllll}
\hline
Summary of computational transaction \tabularnewline
Raw Input & view raw input (R code)  \tabularnewline
Raw Output & view raw output of R engine  \tabularnewline
Computing time & 1 seconds \tabularnewline
R Server & 'Gwilym Jenkins' @ 72.249.127.135 \tabularnewline
\hline
\end{tabular}
%Source: https://freestatistics.org/blog/index.php?pk=24241&T=0

[TABLE]
[ROW][C]Summary of computational transaction[/C][/ROW]
[ROW][C]Raw Input[/C][C]view raw input (R code) [/C][/ROW]
[ROW][C]Raw Output[/C][C]view raw output of R engine [/C][/ROW]
[ROW][C]Computing time[/C][C]1 seconds[/C][/ROW]
[ROW][C]R Server[/C][C]'Gwilym Jenkins' @ 72.249.127.135[/C][/ROW]
[/TABLE]
Source: https://freestatistics.org/blog/index.php?pk=24241&T=0

Globally Unique Identifier (entire table): ba.freestatistics.org/blog/index.php?pk=24241&T=0

As an alternative you can also use a QR Code:  

The GUIDs for individual cells are displayed in the table below:

Summary of computational transaction
Raw Inputview raw input (R code)
Raw Outputview raw output of R engine
Computing time1 seconds
R Server'Gwilym Jenkins' @ 72.249.127.135


Box-Cox Linearity Plot
# observations x74
maximum correlation0.906918290092313
optimal lambda(x)2
Residual SD (orginial)6.31125742067693
Residual SD (transformed)6.03583515145677

\begin{tabular}{lllllllll}
\hline
Box-Cox Linearity Plot \tabularnewline
# observations x & 74 \tabularnewline
maximum correlation & 0.906918290092313 \tabularnewline
optimal lambda(x) & 2 \tabularnewline
Residual SD (orginial) & 6.31125742067693 \tabularnewline
Residual SD (transformed) & 6.03583515145677 \tabularnewline
\hline
\end{tabular}
%Source: https://freestatistics.org/blog/index.php?pk=24241&T=1

[TABLE]
[ROW][C]Box-Cox Linearity Plot[/C][/ROW]
[ROW][C]# observations x[/C][C]74[/C][/ROW]
[ROW][C]maximum correlation[/C][C]0.906918290092313[/C][/ROW]
[ROW][C]optimal lambda(x)[/C][C]2[/C][/ROW]
[ROW][C]Residual SD (orginial)[/C][C]6.31125742067693[/C][/ROW]
[ROW][C]Residual SD (transformed)[/C][C]6.03583515145677[/C][/ROW]
[/TABLE]
Source: https://freestatistics.org/blog/index.php?pk=24241&T=1

Globally Unique Identifier (entire table): ba.freestatistics.org/blog/index.php?pk=24241&T=1

As an alternative you can also use a QR Code:  

The GUIDs for individual cells are displayed in the table below:

Box-Cox Linearity Plot
# observations x74
maximum correlation0.906918290092313
optimal lambda(x)2
Residual SD (orginial)6.31125742067693
Residual SD (transformed)6.03583515145677


Parameters (Session):
Parameters (R input):
R code (references can be found in the software module):
n <- length(x)
c <- array(NA,dim=c(401))
l <- array(NA,dim=c(401))
mx <- 0
mxli <- -999
for (i in 1:401)
{
l[i] <- (i-201)/100
if (l[i] != 0)
{
x1 <- (x^l[i] - 1) / l[i]
} else {
x1 <- log(x)
}
c[i] <- cor(x1,y)
if (mx < abs(c[i]))
{
mx <- abs(c[i])
mxli <- l[i]
}
}
c
mx
mxli
if (mxli != 0)
{
x1 <- (x^mxli - 1) / mxli
} else {
x1 <- log(x)
}
r<-lm(y~x)
se <- sqrt(var(r$residuals))
r1 <- lm(y~x1)
se1 <- sqrt(var(r1$residuals))
bitmap(file='test1.png')
plot(l,c,main='Box-Cox Linearity Plot',xlab='Lambda',ylab='correlation')
grid()
dev.off()
bitmap(file='test2.png')
plot(x,y,main='Linear Fit of Original Data',xlab='x',ylab='y')
abline(r)
grid()
mtext(paste('Residual Standard Deviation = ',se))
dev.off()
bitmap(file='test3.png')
plot(x1,y,main='Linear Fit of Transformed Data',xlab='x',ylab='y')
abline(r1)
grid()
mtext(paste('Residual Standard Deviation = ',se1))
dev.off()
load(file='createtable')
a<-table.start()
a<-table.row.start(a)
a<-table.element(a,'Box-Cox Linearity Plot',2,TRUE)
a<-table.row.end(a)
a<-table.row.start(a)
a<-table.element(a,'# observations x',header=TRUE)
a<-table.element(a,n)
a<-table.row.end(a)
a<-table.row.start(a)
a<-table.element(a,'maximum correlation',header=TRUE)
a<-table.element(a,mx)
a<-table.row.end(a)
a<-table.row.start(a)
a<-table.element(a,'optimal lambda(x)',header=TRUE)
a<-table.element(a,mxli)
a<-table.row.end(a)
a<-table.row.start(a)
a<-table.element(a,'Residual SD (orginial)',header=TRUE)
a<-table.element(a,se)
a<-table.row.end(a)
a<-table.row.start(a)
a<-table.element(a,'Residual SD (transformed)',header=TRUE)
a<-table.element(a,se1)
a<-table.row.end(a)
a<-table.end(a)
table.save(a,file='mytable.tab')