Free Statistics

of Irreproducible Research!

Author's title

Author*The author of this computation has been verified*
R Software Modulerwasp_meanplot.wasp
Title produced by softwareMean Plot
Date of computationWed, 12 Nov 2008 08:00:29 -0700
Cite this page as followsStatistical Computations at FreeStatistics.org, Office for Research Development and Education, URL https://freestatistics.org/blog/index.php?v=date/2008/Nov/12/t1226502271y9dncffz1sqfjcp.htm/, Retrieved Sun, 19 May 2024 12:34:37 +0000
Statistical Computations at FreeStatistics.org, Office for Research Development and Education, URL https://freestatistics.org/blog/index.php?pk=24234, Retrieved Sun, 19 May 2024 12:34:37 +0000
QR Codes:

Original text written by user:
IsPrivate?No (this computation is public)
User-defined keywords
Estimated Impact156
Family? (F = Feedback message, R = changed R code, M = changed R Module, P = changed Parameters, D = changed Data)
F       [Mean Plot] [Mean Plot] [2008-11-12 15:00:29] [98255691c21504803b38711776845ae0] [Current]
Feedback Forum
2008-11-19 12:14:26 [Eline Van Meirhaeghe] [reply
Antwoord: De testwaarde = 100. Er wordt gevraagd om te achterhalen of dat bij de verschillende jaren (1-5) ook zo is(=nulhypothese). Hiervoor kijken we naar 2 belangrijke waarden:
1. p-value: is deze groter dan 0.05 dan gaan we niet verwerpen. Dan is er geen significant verschil en kan men stellen dat men dezelfde waarde heft als de test-/startwaarde.
2. We gaan nagaan of de waarde ‘100’ in het interval van de 2-sided confidence interval ligt in elk jaar. Als dit zo is dan gaan we de nulhypothese niet verwerpen.
Ter illustratie: - jaar 1: p-value=0.069 => >0.05 => niet verwerpen.
100 is een element van het interval [ 86.7382319761622 , 100.595101357171 ], dus ook niet verwerpen.
- jaar 2: p-value= 0.0097 => <0.05 => verwerpen
100 is geen element van het interval [ 82.2218544279892 , 96.9281455720108 ] dus is het verschil te groot om 100 als test-/ startwaarde te hebben.
Op deze manier kan je van alle jaren de waarden gaan controleren en zal je tot de conclusie komen dat enkel in jaar 1 een testwaarde werd aangenomen van 100, dus enkel in jaar 1 wordt de hulhypothese niet verworpen.

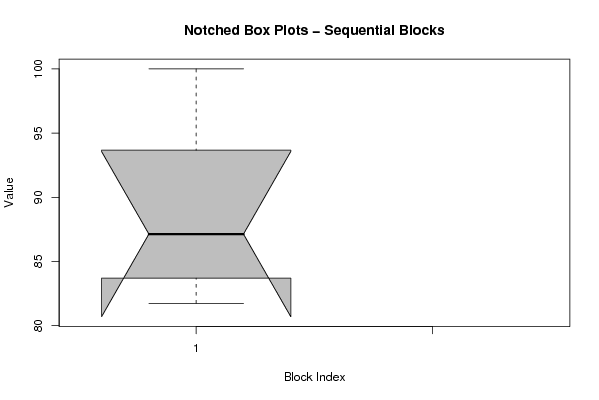
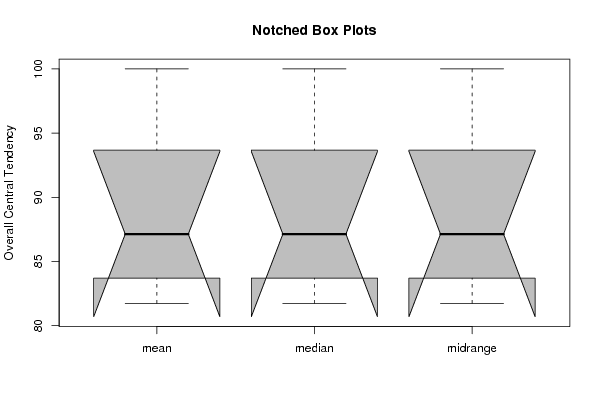
Nog een andere manier om dit na te gaan is via EDA, de grafieken beschouwen aan de hand van de notched boxplots. Wanneer men een denkbeeldige horizontale lijn trekt vanaf de waarde 100 over de boxplots heen, kan je zien dat deze lijn enkel het betrouwbaarheidsinterval van de eerste boxplot doorkruisd. Wat opnieuw duidt op het feit dat de nulhypothese enkel in jaar 1 niet mag worden verworpen.

2008-11-19 12:15:30 [Eline Van Meirhaeghe] [reply
Q2) Antwoord: OM op deze vraag te beantwoorden gaan we 2zijdig moeten gaant testen. Om dit te doen moeten we de simpele formule gebruiken: p-value/2. Wanneer deze kleiner is dan 0.05 gaan we de nulhypothese verwerpen, wat na uitrekening het geval blijkt de zijn bij alle 5 de jaren.

Post a new message
Dataseries X:
100
93.6666666666667
89.5750000000000
83.6916666666667
84.6833333333333
81.7333333333333


Summary of computational transaction
Raw Inputview raw input (R code)
Raw Outputview raw output of R engine
Computing time3 seconds
R Server'Gwilym Jenkins' @ 72.249.127.135

\begin{tabular}{lllllllll}
\hline
Summary of computational transaction \tabularnewline
Raw Input & view raw input (R code)  \tabularnewline
Raw Output & view raw output of R engine  \tabularnewline
Computing time & 3 seconds \tabularnewline
R Server & 'Gwilym Jenkins' @ 72.249.127.135 \tabularnewline
\hline
\end{tabular}
%Source: https://freestatistics.org/blog/index.php?pk=24234&T=0

[TABLE]
[ROW][C]Summary of computational transaction[/C][/ROW]
[ROW][C]Raw Input[/C][C]view raw input (R code) [/C][/ROW]
[ROW][C]Raw Output[/C][C]view raw output of R engine [/C][/ROW]
[ROW][C]Computing time[/C][C]3 seconds[/C][/ROW]
[ROW][C]R Server[/C][C]'Gwilym Jenkins' @ 72.249.127.135[/C][/ROW]
[/TABLE]
Source: https://freestatistics.org/blog/index.php?pk=24234&T=0

Globally Unique Identifier (entire table): ba.freestatistics.org/blog/index.php?pk=24234&T=0

As an alternative you can also use a QR Code:  

The GUIDs for individual cells are displayed in the table below:

Summary of computational transaction
Raw Inputview raw input (R code)
Raw Outputview raw output of R engine
Computing time3 seconds
R Server'Gwilym Jenkins' @ 72.249.127.135


Parameters (Session):
par1 = 6 ;
Parameters (R input):
par1 = 6 ;
R code (references can be found in the software module):
par1 <- as.numeric(par1)
(n <- length(x))
(np <- floor(n / par1))
arr <- array(NA,dim=c(par1,np+1))
darr <- array(NA,dim=c(par1,np+1))
ari <- array(0,dim=par1)
dx <- diff(x)
j <- 0
for (i in 1:n)
{
j = j + 1
ari[j] = ari[j] + 1
arr[j,ari[j]] <- x[i]
darr[j,ari[j]] <- dx[i]
if (j == par1) j = 0
}
ari
arr
darr
arr.mean <- array(NA,dim=par1)
arr.median <- array(NA,dim=par1)
arr.midrange <- array(NA,dim=par1)
for (j in 1:par1)
{
arr.mean[j] <- mean(arr[j,],na.rm=TRUE)
arr.median[j] <- median(arr[j,],na.rm=TRUE)
arr.midrange[j] <- (quantile(arr[j,],0.75,na.rm=TRUE) + quantile(arr[j,],0.25,na.rm=TRUE)) / 2
}
overall.mean <- mean(x)
overall.median <- median(x)
overall.midrange <- (quantile(x,0.75) + quantile(x,0.25)) / 2
bitmap(file='plot1.png')
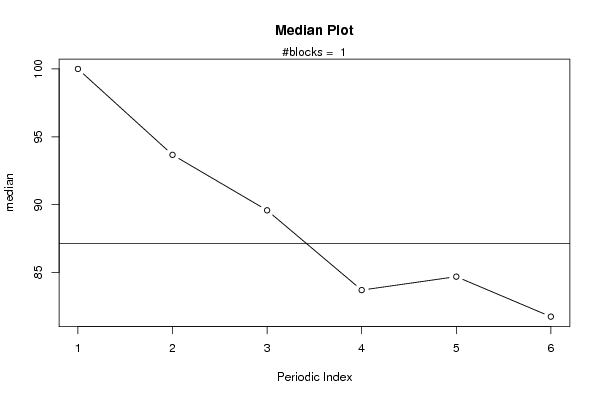
plot(arr.mean,type='b',ylab='mean',main='Mean Plot',xlab='Periodic Index')
mtext(paste('#blocks = ',np))
abline(overall.mean,0)
dev.off()
bitmap(file='plot2.png')
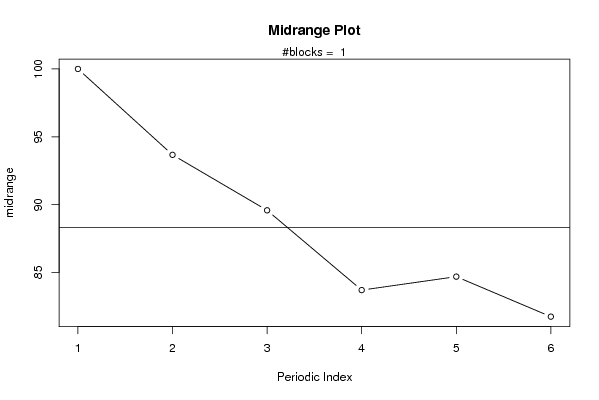
plot(arr.median,type='b',ylab='median',main='Median Plot',xlab='Periodic Index')
mtext(paste('#blocks = ',np))
abline(overall.median,0)
dev.off()
bitmap(file='plot3.png')
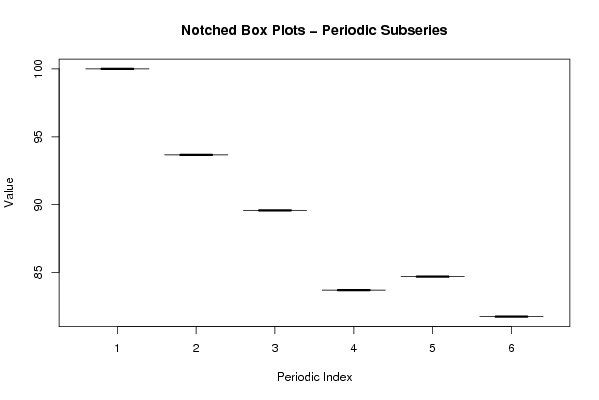
plot(arr.midrange,type='b',ylab='midrange',main='Midrange Plot',xlab='Periodic Index')
mtext(paste('#blocks = ',np))
abline(overall.midrange,0)
dev.off()
bitmap(file='plot4.png')
z <- data.frame(t(arr))
names(z) <- c(1:par1)
(boxplot(z,notch=TRUE,col='grey',xlab='Periodic Index',ylab='Value',main='Notched Box Plots - Periodic Subseries'))
dev.off()
bitmap(file='plot4b.png')
z <- data.frame(t(darr))
names(z) <- c(1:par1)
(boxplot(z,notch=TRUE,col='grey',xlab='Periodic Index',ylab='Value',main='Notched Box Plots - Differenced Periodic Subseries'))
dev.off()
bitmap(file='plot5.png')
z <- data.frame(arr)
names(z) <- c(1:np)
(boxplot(z,notch=TRUE,col='grey',xlab='Block Index',ylab='Value',main='Notched Box Plots - Sequential Blocks'))
dev.off()
bitmap(file='plot6.png')
z <- data.frame(cbind(arr.mean,arr.median,arr.midrange))
names(z) <- list('mean','median','midrange')
(boxplot(z,notch=TRUE,col='grey',ylab='Overall Central Tendency',main='Notched Box Plots'))
dev.off()