Free Statistics

of Irreproducible Research!

Author's title

Author*Unverified author*
R Software Modulerwasp_cloud.wasp
Title produced by softwareTrivariate Scatterplots
Date of computationWed, 12 Nov 2008 07:58:52 -0700
Cite this page as followsStatistical Computations at FreeStatistics.org, Office for Research Development and Education, URL https://freestatistics.org/blog/index.php?v=date/2008/Nov/12/t1226502020ftucvxipiep57h8.htm/, Retrieved Tue, 28 May 2024 12:28:59 +0000
Statistical Computations at FreeStatistics.org, Office for Research Development and Education, URL https://freestatistics.org/blog/index.php?pk=24226, Retrieved Tue, 28 May 2024 12:28:59 +0000
QR Codes:

Original text written by user:
IsPrivate?No (this computation is public)
User-defined keywords
Estimated Impact160
Family? (F = Feedback message, R = changed R code, M = changed R Module, P = changed Parameters, D = changed Data)
F       [Trivariate Scatterplots] [opdracht3Q1] [2008-11-12 14:58:52] [e8ace8b3d80d7fc51f1760fb13a6fe6b] [Current]
Feedback Forum
2008-11-19 17:57:04 [Steven Vercammen] [reply
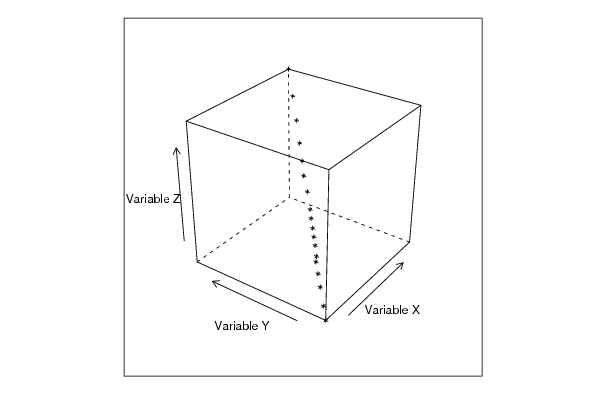
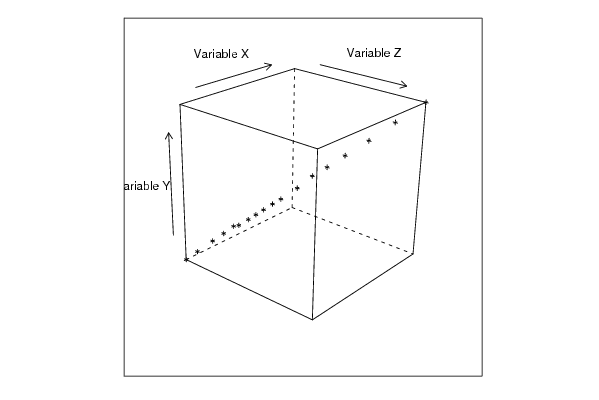
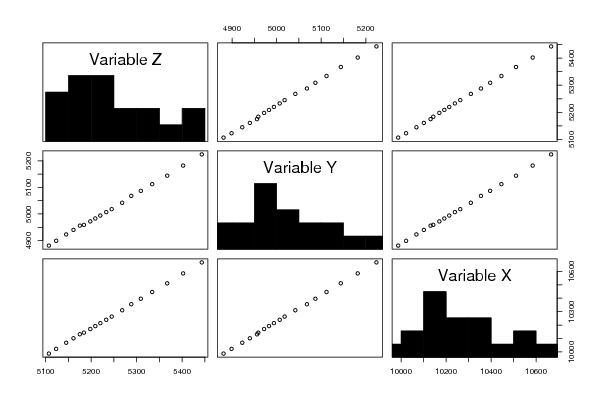
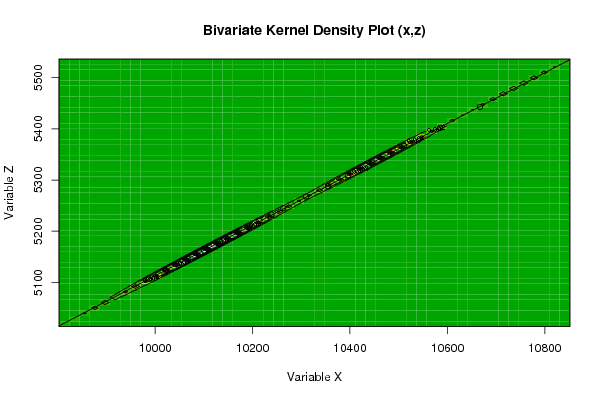
Er wordt geen uitleg gegeven aan wat de trivariate scatterplots nu eigenlijk als functie hebben. De Trivariate Scatterplots vormen een mogelijkheid om het verband tussen 3 variabelen gelijktijdig weer te geven. Zo wordt een puntenwolk weergegeven in een kubus(3 assen)en vanuit verschillende standpunten weergegeven. Op die manier kunnen andere patronen worden weergegeven. Het is wel zo dat door een driedimensionaal voorwerp (de kubus) weer te geven op een tweedimensionaal vlak er bepaalde informatie verloren gaat. Er wordt ook nog wel een extra grafiek met scatterplots en histogrammen gegeven. De scatterplots kunnen echter ook (licht) vertekend beeld geven. Hier is er echter in alle gevallen duidelijk sprake van een positief lineair verband. De student(e) vermeldt wel dat we hierdoor kunnen concluderen dat de bevolking lineair is toegenomen, dit heeft hier echter niets mee te maken.
2008-11-21 21:08:38 [Gilliam Schoorel] [reply
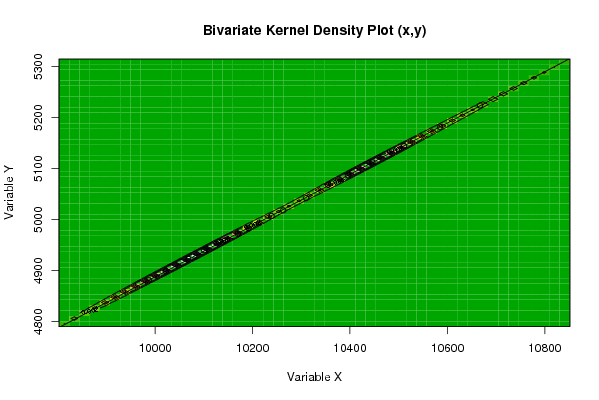
Er wordt geen additionele uitleg gegeven over de trivariate correlatie. Bijkomend als uitleg kan gezegd worden dat men met deze methode de correlatie (de verbanden) gelijktijdig van 3 variabelen kan onderzoeken. Men kan de variabelen vanuit verschillende perspectieven(driedimensionale scatterplot) bekijken om zo nieuwe conclusies en verbanden te ontdekken. Er is wel een vertekening door de rotatie. Zo is het mogelijk om puntenwolken beter de analyseren. Elke scatterplot is vervormd omdat de informatie gereduceerd wordt door de projecties. Dit kan je wel oplossen door het gebruik van bivariate density. (3de demensie wordt hier beperkt tot hoogte lijnen)
Als de scatterplot een dalend verloop vertoont, vind er een tegengestelde werking plaats tussen de variabelen. Als de variabele op de x-as vergroot zal de variabele op de y-as verkleinen. Volgens mij heb je echter wel een tijdreeks voor 2 variabelen gebruikt terwijl je hier wel een tijdreeks met 3 vars moet gebruiken. Bijvoorbeeld totale productie, auto productie en investering...

Post a new message
Dataseries X:
9987
10022
10068
10101
10131
10143
10170
10192
10214
10239
10263
10310
10355
10396
10446
10511
10585
10667
Dataseries Y:
4881
4899
4923
4940
4956
4959
4972
4983
4994
5007
5018
5042
5068
5087
5112
5144
5182
5224
Dataseries Z:
5107
5123
5145
5161
5175
5184
5198
5209
5220
5233
5245
5268
5288
5309
5334
5367
5402
5443


Summary of computational transaction
Raw Inputview raw input (R code)
Raw Outputview raw output of R engine
Computing time6 seconds
R Server'Herman Ole Andreas Wold' @ 193.190.124.10:1001

\begin{tabular}{lllllllll}
\hline
Summary of computational transaction \tabularnewline
Raw Input & view raw input (R code)  \tabularnewline
Raw Output & view raw output of R engine  \tabularnewline
Computing time & 6 seconds \tabularnewline
R Server & 'Herman Ole Andreas Wold' @ 193.190.124.10:1001 \tabularnewline
\hline
\end{tabular}
%Source: https://freestatistics.org/blog/index.php?pk=24226&T=0

[TABLE]
[ROW][C]Summary of computational transaction[/C][/ROW]
[ROW][C]Raw Input[/C][C]view raw input (R code) [/C][/ROW]
[ROW][C]Raw Output[/C][C]view raw output of R engine [/C][/ROW]
[ROW][C]Computing time[/C][C]6 seconds[/C][/ROW]
[ROW][C]R Server[/C][C]'Herman Ole Andreas Wold' @ 193.190.124.10:1001[/C][/ROW]
[/TABLE]
Source: https://freestatistics.org/blog/index.php?pk=24226&T=0

Globally Unique Identifier (entire table): ba.freestatistics.org/blog/index.php?pk=24226&T=0

As an alternative you can also use a QR Code:  

The GUIDs for individual cells are displayed in the table below:

Summary of computational transaction
Raw Inputview raw input (R code)
Raw Outputview raw output of R engine
Computing time6 seconds
R Server'Herman Ole Andreas Wold' @ 193.190.124.10:1001


Parameters (Session):
par1 = 50 ; par2 = 50 ; par3 = Y ; par4 = Y ; par5 = Variable X ; par6 = Variable Y ; par7 = Variable Z ;
Parameters (R input):
par1 = 50 ; par2 = 50 ; par3 = Y ; par4 = Y ; par5 = Variable X ; par6 = Variable Y ; par7 = Variable Z ;
R code (references can be found in the software module):
x <- array(x,dim=c(length(x),1))
colnames(x) <- par5
y <- array(y,dim=c(length(y),1))
colnames(y) <- par6
z <- array(z,dim=c(length(z),1))
colnames(z) <- par7
d <- data.frame(cbind(z,y,x))
colnames(d) <- list(par7,par6,par5)
par1 <- as.numeric(par1)
par2 <- as.numeric(par2)
if (par1>500) par1 <- 500
if (par2>500) par2 <- 500
if (par1<10) par1 <- 10
if (par2<10) par2 <- 10
library(GenKern)
library(lattice)
panel.hist <- function(x, ...)
{
usr <- par('usr'); on.exit(par(usr))
par(usr = c(usr[1:2], 0, 1.5) )
h <- hist(x, plot = FALSE)
breaks <- h$breaks; nB <- length(breaks)
y <- h$counts; y <- y/max(y)
rect(breaks[-nB], 0, breaks[-1], y, col='black', ...)
}
bitmap(file='cloud1.png')
cloud(z~x*y, screen = list(x=-45, y=45, z=35),xlab=par5,ylab=par6,zlab=par7)
dev.off()
bitmap(file='cloud2.png')
cloud(z~x*y, screen = list(x=35, y=45, z=25),xlab=par5,ylab=par6,zlab=par7)
dev.off()
bitmap(file='cloud3.png')
cloud(z~x*y, screen = list(x=35, y=-25, z=90),xlab=par5,ylab=par6,zlab=par7)
dev.off()
bitmap(file='pairs.png')
pairs(d,diag.panel=panel.hist)
dev.off()
x <- as.vector(x)
y <- as.vector(y)
z <- as.vector(z)
bitmap(file='bidensity1.png')
op <- KernSur(x,y, xgridsize=par1, ygridsize=par2, correlation=cor(x,y), xbandwidth=dpik(x), ybandwidth=dpik(y))
image(op$xords, op$yords, op$zden, col=terrain.colors(100), axes=TRUE,main='Bivariate Kernel Density Plot (x,y)',xlab=par5,ylab=par6)
if (par3=='Y') contour(op$xords, op$yords, op$zden, add=TRUE)
if (par4=='Y') points(x,y)
(r<-lm(y ~ x))
abline(r)
box()
dev.off()
bitmap(file='bidensity2.png')
op <- KernSur(y,z, xgridsize=par1, ygridsize=par2, correlation=cor(y,z), xbandwidth=dpik(y), ybandwidth=dpik(z))
op
image(op$xords, op$yords, op$zden, col=terrain.colors(100), axes=TRUE,main='Bivariate Kernel Density Plot (y,z)',xlab=par6,ylab=par7)
if (par3=='Y') contour(op$xords, op$yords, op$zden, add=TRUE)
if (par4=='Y') points(y,z)
(r<-lm(z ~ y))
abline(r)
box()
dev.off()
bitmap(file='bidensity3.png')
op <- KernSur(x,z, xgridsize=par1, ygridsize=par2, correlation=cor(x,z), xbandwidth=dpik(x), ybandwidth=dpik(z))
op
image(op$xords, op$yords, op$zden, col=terrain.colors(100), axes=TRUE,main='Bivariate Kernel Density Plot (x,z)',xlab=par5,ylab=par7)
if (par3=='Y') contour(op$xords, op$yords, op$zden, add=TRUE)
if (par4=='Y') points(x,z)
(r<-lm(z ~ x))
abline(r)
box()
dev.off()