Free Statistics

of Irreproducible Research!

Author's title

Author*Unverified author*
R Software Modulerwasp_boxcoxlin.wasp
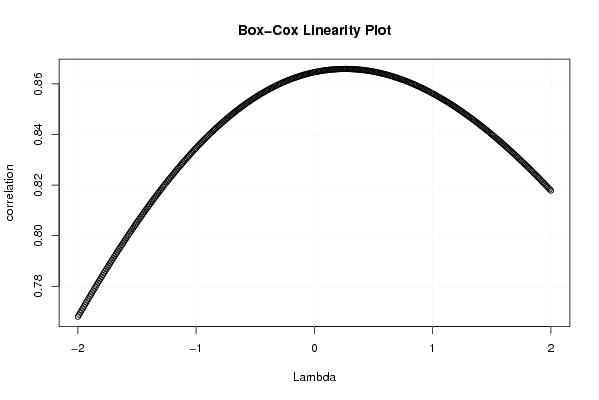
Title produced by softwareBox-Cox Linearity Plot
Date of computationWed, 12 Nov 2008 07:44:58 -0700
Cite this page as followsStatistical Computations at FreeStatistics.org, Office for Research Development and Education, URL https://freestatistics.org/blog/index.php?v=date/2008/Nov/12/t1226501568yzwdv1mrjkoha0c.htm/, Retrieved Sun, 19 May 2024 08:55:48 +0000
Statistical Computations at FreeStatistics.org, Office for Research Development and Education, URL https://freestatistics.org/blog/index.php?pk=24221, Retrieved Sun, 19 May 2024 08:55:48 +0000
QR Codes:

Original text written by user:
IsPrivate?No (this computation is public)
User-defined keywords
Estimated Impact162
Family? (F = Feedback message, R = changed R code, M = changed R Module, P = changed Parameters, D = changed Data)
F       [Box-Cox Linearity Plot] [Stefan Temmerman] [2008-11-12 14:44:58] [7866e091edc3e3e9f6a037e9d19fcaa2] [Current]
-    D    [Box-Cox Linearity Plot] [Various EDA topic...] [2008-11-13 21:50:47] [ff3cbec2dc497cddefec153d0a88b59b]
F    D    [Box-Cox Linearity Plot] [Various EDA topic...] [2008-11-13 21:53:32] [ff3cbec2dc497cddefec153d0a88b59b]
Feedback Forum
2008-11-18 10:14:58 [72e979bcc364082694890d2eccc1a66f] [reply
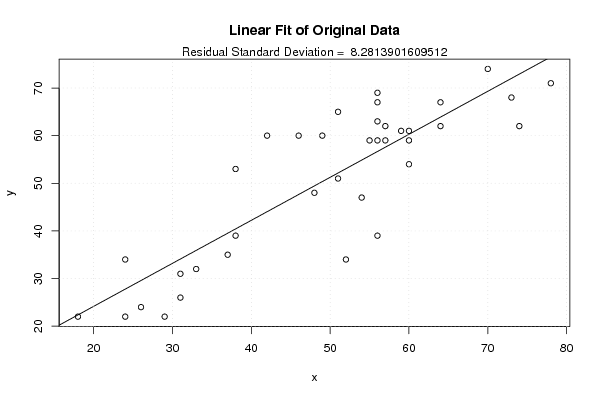
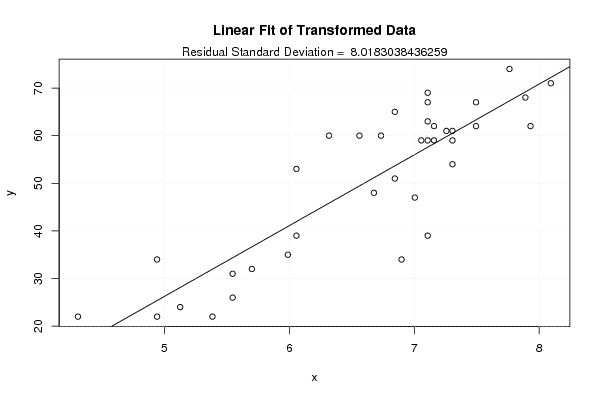
Door de transformatie toe te passen, wordt er geprobeerd om de resultaten meer lineair te krijgen. We merken een heel lichte verandering waardoor de resultaten dichter bij elkaar komen te liggen.
2008-11-18 14:33:53 [Stefan Temmerman] [reply
De Box-Cox linearity plot voert een transformatie door om de variabelen meer lineair te zetten. Hiervoor wordt de functie getest met verschillende lambda's, om zo een beter verband te krijgen. De waarde die de hoogste correlatiecoëfficiënt voor functie oplevert, wordt gekozen om de grafiek te transformeren(te zien op de grafiek als het maximum van de linearity plot).
In het voorbeeld van de student, is de optimale lambda waarde ongeveer 0.3. Als we functie transformeren met behulp van deze waarde 0.3, zou deze een beter verband opleveren. Dit is te merken aan de kleinere standaarddeviatie.
2008-11-24 21:06:19 [5faab2fc6fb120339944528a32d48a04] [reply
Deze plot voert een transformatie door om de variabelen meer lineair te maken. Hiervoor wordt de functie aan de hand van de Box-Cox formule, om zo het optimale verband te vinden. De lambda-waarde, die schommelt tussen -2 en 2, die de hoogste correlatiecoëfficiënt voor de functie oplevert, wordt gebruikt om de grafiek te transformeren. De transformatie wordt doorgevoerd op de X-variabelen. De optimale lambda is hier 0,26. De transformatie heeft echter weinig effect.De standaarddeviatie veranderd slechts met 0,28.

Post a new message
Dataseries X:
64
48
38
31
26
33
78
74
57
59
24
60
73
46
51
31
42
56
70
56
49
57
18
64
56
56
37
24
60
60
38
56
52
55
29
54
51
Dataseries Y:
62
48
53
26
24
32
71
62
62
61
22
61
68
60
51
31
60
67
74
39
60
59
22
67
69
63
35
34
54
59
39
59
34
59
22
47
65


Summary of computational transaction
Raw Inputview raw input (R code)
Raw Outputview raw output of R engine
Computing time2 seconds
R Server'George Udny Yule' @ 72.249.76.132

\begin{tabular}{lllllllll}
\hline
Summary of computational transaction \tabularnewline
Raw Input & view raw input (R code)  \tabularnewline
Raw Output & view raw output of R engine  \tabularnewline
Computing time & 2 seconds \tabularnewline
R Server & 'George Udny Yule' @ 72.249.76.132 \tabularnewline
\hline
\end{tabular}
%Source: https://freestatistics.org/blog/index.php?pk=24221&T=0

[TABLE]
[ROW][C]Summary of computational transaction[/C][/ROW]
[ROW][C]Raw Input[/C][C]view raw input (R code) [/C][/ROW]
[ROW][C]Raw Output[/C][C]view raw output of R engine [/C][/ROW]
[ROW][C]Computing time[/C][C]2 seconds[/C][/ROW]
[ROW][C]R Server[/C][C]'George Udny Yule' @ 72.249.76.132[/C][/ROW]
[/TABLE]
Source: https://freestatistics.org/blog/index.php?pk=24221&T=0

Globally Unique Identifier (entire table): ba.freestatistics.org/blog/index.php?pk=24221&T=0

As an alternative you can also use a QR Code:  

The GUIDs for individual cells are displayed in the table below:

Summary of computational transaction
Raw Inputview raw input (R code)
Raw Outputview raw output of R engine
Computing time2 seconds
R Server'George Udny Yule' @ 72.249.76.132


Box-Cox Linearity Plot
# observations x37
maximum correlation0.865944390353226
optimal lambda(x)0.26
Residual SD (orginial)8.2813901609512
Residual SD (transformed)8.0183038436259

\begin{tabular}{lllllllll}
\hline
Box-Cox Linearity Plot \tabularnewline
# observations x & 37 \tabularnewline
maximum correlation & 0.865944390353226 \tabularnewline
optimal lambda(x) & 0.26 \tabularnewline
Residual SD (orginial) & 8.2813901609512 \tabularnewline
Residual SD (transformed) & 8.0183038436259 \tabularnewline
\hline
\end{tabular}
%Source: https://freestatistics.org/blog/index.php?pk=24221&T=1

[TABLE]
[ROW][C]Box-Cox Linearity Plot[/C][/ROW]
[ROW][C]# observations x[/C][C]37[/C][/ROW]
[ROW][C]maximum correlation[/C][C]0.865944390353226[/C][/ROW]
[ROW][C]optimal lambda(x)[/C][C]0.26[/C][/ROW]
[ROW][C]Residual SD (orginial)[/C][C]8.2813901609512[/C][/ROW]
[ROW][C]Residual SD (transformed)[/C][C]8.0183038436259[/C][/ROW]
[/TABLE]
Source: https://freestatistics.org/blog/index.php?pk=24221&T=1

Globally Unique Identifier (entire table): ba.freestatistics.org/blog/index.php?pk=24221&T=1

As an alternative you can also use a QR Code:  

The GUIDs for individual cells are displayed in the table below:

Box-Cox Linearity Plot
# observations x37
maximum correlation0.865944390353226
optimal lambda(x)0.26
Residual SD (orginial)8.2813901609512
Residual SD (transformed)8.0183038436259


Parameters (Session):
Parameters (R input):
R code (references can be found in the software module):
n <- length(x)
c <- array(NA,dim=c(401))
l <- array(NA,dim=c(401))
mx <- 0
mxli <- -999
for (i in 1:401)
{
l[i] <- (i-201)/100
if (l[i] != 0)
{
x1 <- (x^l[i] - 1) / l[i]
} else {
x1 <- log(x)
}
c[i] <- cor(x1,y)
if (mx < abs(c[i]))
{
mx <- abs(c[i])
mxli <- l[i]
}
}
c
mx
mxli
if (mxli != 0)
{
x1 <- (x^mxli - 1) / mxli
} else {
x1 <- log(x)
}
r<-lm(y~x)
se <- sqrt(var(r$residuals))
r1 <- lm(y~x1)
se1 <- sqrt(var(r1$residuals))
bitmap(file='test1.png')
plot(l,c,main='Box-Cox Linearity Plot',xlab='Lambda',ylab='correlation')
grid()
dev.off()
bitmap(file='test2.png')
plot(x,y,main='Linear Fit of Original Data',xlab='x',ylab='y')
abline(r)
grid()
mtext(paste('Residual Standard Deviation = ',se))
dev.off()
bitmap(file='test3.png')
plot(x1,y,main='Linear Fit of Transformed Data',xlab='x',ylab='y')
abline(r1)
grid()
mtext(paste('Residual Standard Deviation = ',se1))
dev.off()
load(file='createtable')
a<-table.start()
a<-table.row.start(a)
a<-table.element(a,'Box-Cox Linearity Plot',2,TRUE)
a<-table.row.end(a)
a<-table.row.start(a)
a<-table.element(a,'# observations x',header=TRUE)
a<-table.element(a,n)
a<-table.row.end(a)
a<-table.row.start(a)
a<-table.element(a,'maximum correlation',header=TRUE)
a<-table.element(a,mx)
a<-table.row.end(a)
a<-table.row.start(a)
a<-table.element(a,'optimal lambda(x)',header=TRUE)
a<-table.element(a,mxli)
a<-table.row.end(a)
a<-table.row.start(a)
a<-table.element(a,'Residual SD (orginial)',header=TRUE)
a<-table.element(a,se)
a<-table.row.end(a)
a<-table.row.start(a)
a<-table.element(a,'Residual SD (transformed)',header=TRUE)
a<-table.element(a,se1)
a<-table.row.end(a)
a<-table.end(a)
table.save(a,file='mytable.tab')