Free Statistics

of Irreproducible Research!

Author's title

Author*Unverified author*
R Software Modulerwasp_hierarchicalclustering.wasp
Title produced by softwareHierarchical Clustering
Date of computationWed, 12 Nov 2008 07:25:15 -0700
Cite this page as followsStatistical Computations at FreeStatistics.org, Office for Research Development and Education, URL https://freestatistics.org/blog/index.php?v=date/2008/Nov/12/t1226500020dmjeti459k90r0b.htm/, Retrieved Sun, 19 May 2024 12:35:12 +0000
Statistical Computations at FreeStatistics.org, Office for Research Development and Education, URL https://freestatistics.org/blog/index.php?pk=24208, Retrieved Sun, 19 May 2024 12:35:12 +0000
QR Codes:

Original text written by user:
IsPrivate?No (this computation is public)
User-defined keywords
Estimated Impact149
Family? (F = Feedback message, R = changed R code, M = changed R Module, P = changed Parameters, D = changed Data)
-       [Hierarchical Clustering] [] [2008-11-12 14:25:15] [1768685c15539a739b6b33586be71b78] [Current]
Feedback Forum

Post a new message
Dataseries X:
4	18	3
7	0	26
-18	-25	-41
8	12	-1
5	-13	-4
9	12	17
-9	-8	-4
13	12	11
13	7	-18
-23	-13	-23
-10	-12	-12
9	16	16
9	22	7
17	20	18
-29	-25	-47
10	12	3
2	13	13
9	-8	9
23	27	33
9	20	3
-5	13	-29
-16	-16	-36
4	4	-9
-1	13	2
26	21	16
13	14	19
-23	-25	-37
12	14	4
10	15	12
27	15	7


Summary of computational transaction
Raw Inputview raw input (R code)
Raw Outputview raw output of R engine
Computing time3 seconds
R Server'Herman Ole Andreas Wold' @ 193.190.124.10:1001
R Framework error message
The field 'Names of X columns' contains a hard return which cannot be interpreted.
Please, resubmit your request without hard returns in the 'Names of X columns'.

\begin{tabular}{lllllllll}
\hline
Summary of computational transaction \tabularnewline
Raw Input & view raw input (R code)  \tabularnewline
Raw Output & view raw output of R engine  \tabularnewline
Computing time & 3 seconds \tabularnewline
R Server & 'Herman Ole Andreas Wold' @ 193.190.124.10:1001 \tabularnewline
R Framework error message & 
The field 'Names of X columns' contains a hard return which cannot be interpreted.
Please, resubmit your request without hard returns in the 'Names of X columns'.
\tabularnewline \hline \end{tabular} %Source: https://freestatistics.org/blog/index.php?pk=24208&T=0

[TABLE]
[ROW][C]Summary of computational transaction[/C][/ROW]
[ROW][C]Raw Input[/C][C]view raw input (R code) [/C][/ROW]
[ROW][C]Raw Output[/C][C]view raw output of R engine [/C][/ROW]
[ROW][C]Computing time[/C][C]3 seconds[/C][/ROW]
[ROW][C]R Server[/C][C]'Herman Ole Andreas Wold' @ 193.190.124.10:1001[/C][/ROW]
[ROW][C]R Framework error message[/C][C]
The field 'Names of X columns' contains a hard return which cannot be interpreted.
Please, resubmit your request without hard returns in the 'Names of X columns'.
[/C][/ROW] [/TABLE] Source: https://freestatistics.org/blog/index.php?pk=24208&T=0

Globally Unique Identifier (entire table): ba.freestatistics.org/blog/index.php?pk=24208&T=0

As an alternative you can also use a QR Code:  

The GUIDs for individual cells are displayed in the table below:

Summary of computational transaction
Raw Inputview raw input (R code)
Raw Outputview raw output of R engine
Computing time3 seconds
R Server'Herman Ole Andreas Wold' @ 193.190.124.10:1001
R Framework error message
The field 'Names of X columns' contains a hard return which cannot be interpreted.
Please, resubmit your request without hard returns in the 'Names of X columns'.


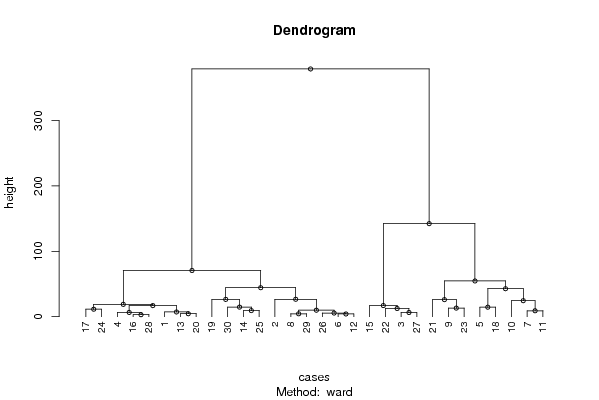
Summary of Dendrogram
LabelHeight
13
24.12310562561766
34.35889894354067
44.47213595499958
55.48172765326135
66.40312423743285
76.4535599249993
87.13262084327031
99
109.2736184954957
119.88153310453261
1211.4017542509914
1312.4880330034965
1413.0766968306220
1514.4913767461894
1614.6069055898737
1716.9019589383961
1817.0038247698129
1918.8275859158113
2024.4555988485744
2126.0666019776065
2226.4279431455367
2326.6026290043406
2442.7500608525669
2544.291960937495
2654.587916114402
2770.6697719420444
28142.295190479896
29378.964735371893

\begin{tabular}{lllllllll}
\hline
Summary of Dendrogram \tabularnewline
Label & Height \tabularnewline
1 & 3 \tabularnewline
2 & 4.12310562561766 \tabularnewline
3 & 4.35889894354067 \tabularnewline
4 & 4.47213595499958 \tabularnewline
5 & 5.48172765326135 \tabularnewline
6 & 6.40312423743285 \tabularnewline
7 & 6.4535599249993 \tabularnewline
8 & 7.13262084327031 \tabularnewline
9 & 9 \tabularnewline
10 & 9.2736184954957 \tabularnewline
11 & 9.88153310453261 \tabularnewline
12 & 11.4017542509914 \tabularnewline
13 & 12.4880330034965 \tabularnewline
14 & 13.0766968306220 \tabularnewline
15 & 14.4913767461894 \tabularnewline
16 & 14.6069055898737 \tabularnewline
17 & 16.9019589383961 \tabularnewline
18 & 17.0038247698129 \tabularnewline
19 & 18.8275859158113 \tabularnewline
20 & 24.4555988485744 \tabularnewline
21 & 26.0666019776065 \tabularnewline
22 & 26.4279431455367 \tabularnewline
23 & 26.6026290043406 \tabularnewline
24 & 42.7500608525669 \tabularnewline
25 & 44.291960937495 \tabularnewline
26 & 54.587916114402 \tabularnewline
27 & 70.6697719420444 \tabularnewline
28 & 142.295190479896 \tabularnewline
29 & 378.964735371893 \tabularnewline
\hline
\end{tabular}
%Source: https://freestatistics.org/blog/index.php?pk=24208&T=1

[TABLE]
[ROW][C]Summary of Dendrogram[/C][/ROW]
[ROW][C]Label[/C][C]Height[/C][/ROW]
[ROW][C]1[/C][C]3[/C][/ROW]
[ROW][C]2[/C][C]4.12310562561766[/C][/ROW]
[ROW][C]3[/C][C]4.35889894354067[/C][/ROW]
[ROW][C]4[/C][C]4.47213595499958[/C][/ROW]
[ROW][C]5[/C][C]5.48172765326135[/C][/ROW]
[ROW][C]6[/C][C]6.40312423743285[/C][/ROW]
[ROW][C]7[/C][C]6.4535599249993[/C][/ROW]
[ROW][C]8[/C][C]7.13262084327031[/C][/ROW]
[ROW][C]9[/C][C]9[/C][/ROW]
[ROW][C]10[/C][C]9.2736184954957[/C][/ROW]
[ROW][C]11[/C][C]9.88153310453261[/C][/ROW]
[ROW][C]12[/C][C]11.4017542509914[/C][/ROW]
[ROW][C]13[/C][C]12.4880330034965[/C][/ROW]
[ROW][C]14[/C][C]13.0766968306220[/C][/ROW]
[ROW][C]15[/C][C]14.4913767461894[/C][/ROW]
[ROW][C]16[/C][C]14.6069055898737[/C][/ROW]
[ROW][C]17[/C][C]16.9019589383961[/C][/ROW]
[ROW][C]18[/C][C]17.0038247698129[/C][/ROW]
[ROW][C]19[/C][C]18.8275859158113[/C][/ROW]
[ROW][C]20[/C][C]24.4555988485744[/C][/ROW]
[ROW][C]21[/C][C]26.0666019776065[/C][/ROW]
[ROW][C]22[/C][C]26.4279431455367[/C][/ROW]
[ROW][C]23[/C][C]26.6026290043406[/C][/ROW]
[ROW][C]24[/C][C]42.7500608525669[/C][/ROW]
[ROW][C]25[/C][C]44.291960937495[/C][/ROW]
[ROW][C]26[/C][C]54.587916114402[/C][/ROW]
[ROW][C]27[/C][C]70.6697719420444[/C][/ROW]
[ROW][C]28[/C][C]142.295190479896[/C][/ROW]
[ROW][C]29[/C][C]378.964735371893[/C][/ROW]
[/TABLE]
Source: https://freestatistics.org/blog/index.php?pk=24208&T=1

Globally Unique Identifier (entire table): ba.freestatistics.org/blog/index.php?pk=24208&T=1

As an alternative you can also use a QR Code:  

The GUIDs for individual cells are displayed in the table below:

Summary of Dendrogram
LabelHeight
13
24.12310562561766
34.35889894354067
44.47213595499958
55.48172765326135
66.40312423743285
76.4535599249993
87.13262084327031
99
109.2736184954957
119.88153310453261
1211.4017542509914
1312.4880330034965
1413.0766968306220
1514.4913767461894
1614.6069055898737
1716.9019589383961
1817.0038247698129
1918.8275859158113
2024.4555988485744
2126.0666019776065
2226.4279431455367
2326.6026290043406
2442.7500608525669
2544.291960937495
2654.587916114402
2770.6697719420444
28142.295190479896
29378.964735371893


Parameters (Session):
par1 = ward ; par2 = ALL ; par3 = FALSE ; par4 = FALSE ;
Parameters (R input):
par1 = ward ; par2 = ALL ; par3 = FALSE ; par4 = FALSE ;
R code (references can be found in the software module):
par3 <- as.logical(par3)
par4 <- as.logical(par4)
if (par3 == 'TRUE'){
dum = xlab
xlab = ylab
ylab = dum
}
x <- t(y)
hc <- hclust(dist(x),method=par1)
d <- as.dendrogram(hc)
str(d)
mysub <- paste('Method: ',par1)
bitmap(file='test1.png')
if (par4 == 'TRUE'){
plot(d,main=main,ylab=ylab,xlab=xlab,horiz=par3, nodePar=list(pch = c(1,NA), cex=0.8, lab.cex = 0.8),type='t',center=T, sub=mysub)
} else {
plot(d,main=main,ylab=ylab,xlab=xlab,horiz=par3, nodePar=list(pch = c(1,NA), cex=0.8, lab.cex = 0.8), sub=mysub)
}
dev.off()
if (par2 != 'ALL'){
if (par3 == 'TRUE'){
ylab = 'cluster'
} else {
xlab = 'cluster'
}
par2 <- as.numeric(par2)
memb <- cutree(hc, k = par2)
cent <- NULL
for(k in 1:par2){
cent <- rbind(cent, colMeans(x[memb == k, , drop = FALSE]))
}
hc1 <- hclust(dist(cent),method=par1, members = table(memb))
de <- as.dendrogram(hc1)
bitmap(file='test2.png')
if (par4 == 'TRUE'){
plot(de,main=main,ylab=ylab,xlab=xlab,horiz=par3, nodePar=list(pch = c(1,NA), cex=0.8, lab.cex = 0.8),type='t',center=T, sub=mysub)
} else {
plot(de,main=main,ylab=ylab,xlab=xlab,horiz=par3, nodePar=list(pch = c(1,NA), cex=0.8, lab.cex = 0.8), sub=mysub)
}
dev.off()
str(de)
}
load(file='createtable')
a<-table.start()
a<-table.row.start(a)
a<-table.element(a,'Summary of Dendrogram',2,TRUE)
a<-table.row.end(a)
a<-table.row.start(a)
a<-table.element(a,'Label',header=TRUE)
a<-table.element(a,'Height',header=TRUE)
a<-table.row.end(a)
num <- length(x[,1])-1
for (i in 1:num)
{
a<-table.row.start(a)
a<-table.element(a,hc$labels[i])
a<-table.element(a,hc$height[i])
a<-table.row.end(a)
}
a<-table.end(a)
table.save(a,file='mytable1.tab')
if (par2 != 'ALL'){
a<-table.start()
a<-table.row.start(a)
a<-table.element(a,'Summary of Cut Dendrogram',2,TRUE)
a<-table.row.end(a)
a<-table.row.start(a)
a<-table.element(a,'Label',header=TRUE)
a<-table.element(a,'Height',header=TRUE)
a<-table.row.end(a)
num <- par2-1
for (i in 1:num)
{
a<-table.row.start(a)
a<-table.element(a,i)
a<-table.element(a,hc1$height[i])
a<-table.row.end(a)
}
a<-table.end(a)
table.save(a,file='mytable2.tab')
}