Free Statistics

of Irreproducible Research!

Author's title

Author*Unverified author*
R Software Modulerwasp_hierarchicalclustering.wasp
Title produced by softwareHierarchical Clustering
Date of computationWed, 12 Nov 2008 07:05:53 -0700
Cite this page as followsStatistical Computations at FreeStatistics.org, Office for Research Development and Education, URL https://freestatistics.org/blog/index.php?v=date/2008/Nov/12/t1226498833aqqznaw4z9f2dlj.htm/, Retrieved Sun, 19 May 2024 10:11:19 +0000
Statistical Computations at FreeStatistics.org, Office for Research Development and Education, URL https://freestatistics.org/blog/index.php?pk=24198, Retrieved Sun, 19 May 2024 10:11:19 +0000
QR Codes:

Original text written by user:
IsPrivate?No (this computation is public)
User-defined keywords
Estimated Impact147
Family? (F = Feedback message, R = changed R code, M = changed R Module, P = changed Parameters, D = changed Data)
F       [Hierarchical Clustering] [Stefan Temmerman] [2008-11-12 14:05:53] [7866e091edc3e3e9f6a037e9d19fcaa2] [Current]
-    D    [Hierarchical Clustering] [Hierarchical Clus...] [2008-11-13 21:34:21] [51ca7048ce38c83a9c71bb236e5f3bed]
-    D    [Hierarchical Clustering] [Hierarchical Clus...] [2008-11-13 21:37:53] [51ca7048ce38c83a9c71bb236e5f3bed]
Feedback Forum
2008-11-18 10:11:54 [72e979bcc364082694890d2eccc1a66f] [reply
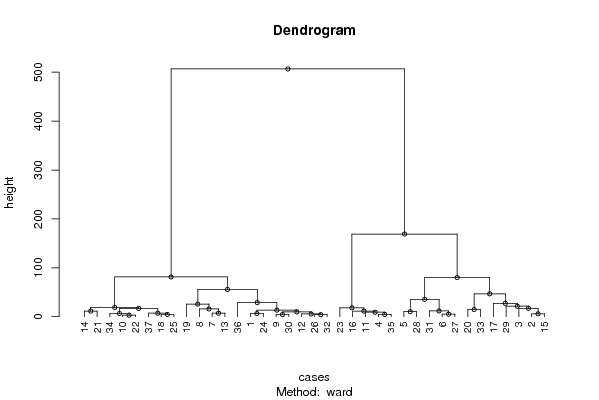
We kunnen concluderen dat de gegevens worden opgedeeld in 2 hoofdclusters, die dan verder worden onderverdeeld. Ik kan me niet verder uitspreken over deze resultaten omdat ik niet weet welke gegevens er gebruikt werden.
2008-11-18 14:31:43 [Stefan Temmerman] [reply
Een dendrogram maakt duidelijk welke observaties in 1 groep zitten. Hier kan men afleiden dat de observaties sterk verspreid over de clusters verdeeld zijn, dus is het moeilijk om conclusies te trekken uit deze verdeling.
2008-11-24 21:02:59 [5faab2fc6fb120339944528a32d48a04] [reply
Door een dendogram te maken kunnen we clustergroepen opsplitsen. Eerst worden de gegevens opgesplitst in 2 groepen. Daarna worden deze 2 telkens opnieuw verder onderverdeeld. Je kan aan de getallen onderaan de dendogram afleiden welke data bij elkaar horen en die dus waarschijnlijk in dezelfde omstandigheden voorvallen. Het is zeer moeilijk om hier een vast patroon in te vinden.

Post a new message
Dataseries X:
17	15	14
1	1	-5
-9	6	-14
-16	-21	-42
-21	-23	-24
-14	-15	-11
31	24	20
27	15	7
10	15	12
12	14	4
-23	-25	-37
13	14	19
26	21	16
-1	13	2
4	4	-9
-16	-16	-36
-5	13	-29
9	20	3
23	27	33
9	-8	9
2	13	13
10	12	3
-29	-25	-47
17	20	18
9	22	7
9	16	16
-10	-12	-12
-23	-13	-23
13	7	-18
13	12	11
-9	-8	-4
9	12	17
5	-13	-4
8	12	-1
-18	-25	-41
7	0	26
4	18	3


Summary of computational transaction
Raw Inputview raw input (R code)
Raw Outputview raw output of R engine
Computing time1 seconds
R Server'George Udny Yule' @ 72.249.76.132

\begin{tabular}{lllllllll}
\hline
Summary of computational transaction \tabularnewline
Raw Input & view raw input (R code)  \tabularnewline
Raw Output & view raw output of R engine  \tabularnewline
Computing time & 1 seconds \tabularnewline
R Server & 'George Udny Yule' @ 72.249.76.132 \tabularnewline
\hline
\end{tabular}
%Source: https://freestatistics.org/blog/index.php?pk=24198&T=0

[TABLE]
[ROW][C]Summary of computational transaction[/C][/ROW]
[ROW][C]Raw Input[/C][C]view raw input (R code) [/C][/ROW]
[ROW][C]Raw Output[/C][C]view raw output of R engine [/C][/ROW]
[ROW][C]Computing time[/C][C]1 seconds[/C][/ROW]
[ROW][C]R Server[/C][C]'George Udny Yule' @ 72.249.76.132[/C][/ROW]
[/TABLE]
Source: https://freestatistics.org/blog/index.php?pk=24198&T=0

Globally Unique Identifier (entire table): ba.freestatistics.org/blog/index.php?pk=24198&T=0

As an alternative you can also use a QR Code:  

The GUIDs for individual cells are displayed in the table below:

Summary of computational transaction
Raw Inputview raw input (R code)
Raw Outputview raw output of R engine
Computing time1 seconds
R Server'George Udny Yule' @ 72.249.76.132


Summary of Dendrogram
LabelHeight
13
24.12310562561766
34.35889894354067
44.47213595499958
54.58257569495584
65.09901951359278
75.48172765326135
85.8309518948453
96.40312423743285
106.4535599249993
117.07106781186548
127.13262084327031
139.06577958030671
149.88153310453261
1510.2469507659596
1611.4017542509914
1711.4598418311182
1811.6940178330753
1913.3570624877570
2014.4913767461894
2115.7578353437117
2216.9019589383961
2317.0056476176366
2418.1562025412358
2518.8275859158113
2621.3614840261249
2725.6656145402072
2827.2256200592315
2928.8332214130526
3035.329307321414
3146.6468241042406
3255.6926787175646
3379.9961033482863
3481.130993735346
35169.088439502579
36506.732949138544

\begin{tabular}{lllllllll}
\hline
Summary of Dendrogram \tabularnewline
Label & Height \tabularnewline
1 & 3 \tabularnewline
2 & 4.12310562561766 \tabularnewline
3 & 4.35889894354067 \tabularnewline
4 & 4.47213595499958 \tabularnewline
5 & 4.58257569495584 \tabularnewline
6 & 5.09901951359278 \tabularnewline
7 & 5.48172765326135 \tabularnewline
8 & 5.8309518948453 \tabularnewline
9 & 6.40312423743285 \tabularnewline
10 & 6.4535599249993 \tabularnewline
11 & 7.07106781186548 \tabularnewline
12 & 7.13262084327031 \tabularnewline
13 & 9.06577958030671 \tabularnewline
14 & 9.88153310453261 \tabularnewline
15 & 10.2469507659596 \tabularnewline
16 & 11.4017542509914 \tabularnewline
17 & 11.4598418311182 \tabularnewline
18 & 11.6940178330753 \tabularnewline
19 & 13.3570624877570 \tabularnewline
20 & 14.4913767461894 \tabularnewline
21 & 15.7578353437117 \tabularnewline
22 & 16.9019589383961 \tabularnewline
23 & 17.0056476176366 \tabularnewline
24 & 18.1562025412358 \tabularnewline
25 & 18.8275859158113 \tabularnewline
26 & 21.3614840261249 \tabularnewline
27 & 25.6656145402072 \tabularnewline
28 & 27.2256200592315 \tabularnewline
29 & 28.8332214130526 \tabularnewline
30 & 35.329307321414 \tabularnewline
31 & 46.6468241042406 \tabularnewline
32 & 55.6926787175646 \tabularnewline
33 & 79.9961033482863 \tabularnewline
34 & 81.130993735346 \tabularnewline
35 & 169.088439502579 \tabularnewline
36 & 506.732949138544 \tabularnewline
\hline
\end{tabular}
%Source: https://freestatistics.org/blog/index.php?pk=24198&T=1

[TABLE]
[ROW][C]Summary of Dendrogram[/C][/ROW]
[ROW][C]Label[/C][C]Height[/C][/ROW]
[ROW][C]1[/C][C]3[/C][/ROW]
[ROW][C]2[/C][C]4.12310562561766[/C][/ROW]
[ROW][C]3[/C][C]4.35889894354067[/C][/ROW]
[ROW][C]4[/C][C]4.47213595499958[/C][/ROW]
[ROW][C]5[/C][C]4.58257569495584[/C][/ROW]
[ROW][C]6[/C][C]5.09901951359278[/C][/ROW]
[ROW][C]7[/C][C]5.48172765326135[/C][/ROW]
[ROW][C]8[/C][C]5.8309518948453[/C][/ROW]
[ROW][C]9[/C][C]6.40312423743285[/C][/ROW]
[ROW][C]10[/C][C]6.4535599249993[/C][/ROW]
[ROW][C]11[/C][C]7.07106781186548[/C][/ROW]
[ROW][C]12[/C][C]7.13262084327031[/C][/ROW]
[ROW][C]13[/C][C]9.06577958030671[/C][/ROW]
[ROW][C]14[/C][C]9.88153310453261[/C][/ROW]
[ROW][C]15[/C][C]10.2469507659596[/C][/ROW]
[ROW][C]16[/C][C]11.4017542509914[/C][/ROW]
[ROW][C]17[/C][C]11.4598418311182[/C][/ROW]
[ROW][C]18[/C][C]11.6940178330753[/C][/ROW]
[ROW][C]19[/C][C]13.3570624877570[/C][/ROW]
[ROW][C]20[/C][C]14.4913767461894[/C][/ROW]
[ROW][C]21[/C][C]15.7578353437117[/C][/ROW]
[ROW][C]22[/C][C]16.9019589383961[/C][/ROW]
[ROW][C]23[/C][C]17.0056476176366[/C][/ROW]
[ROW][C]24[/C][C]18.1562025412358[/C][/ROW]
[ROW][C]25[/C][C]18.8275859158113[/C][/ROW]
[ROW][C]26[/C][C]21.3614840261249[/C][/ROW]
[ROW][C]27[/C][C]25.6656145402072[/C][/ROW]
[ROW][C]28[/C][C]27.2256200592315[/C][/ROW]
[ROW][C]29[/C][C]28.8332214130526[/C][/ROW]
[ROW][C]30[/C][C]35.329307321414[/C][/ROW]
[ROW][C]31[/C][C]46.6468241042406[/C][/ROW]
[ROW][C]32[/C][C]55.6926787175646[/C][/ROW]
[ROW][C]33[/C][C]79.9961033482863[/C][/ROW]
[ROW][C]34[/C][C]81.130993735346[/C][/ROW]
[ROW][C]35[/C][C]169.088439502579[/C][/ROW]
[ROW][C]36[/C][C]506.732949138544[/C][/ROW]
[/TABLE]
Source: https://freestatistics.org/blog/index.php?pk=24198&T=1

Globally Unique Identifier (entire table): ba.freestatistics.org/blog/index.php?pk=24198&T=1

As an alternative you can also use a QR Code:  

The GUIDs for individual cells are displayed in the table below:

Summary of Dendrogram
LabelHeight
13
24.12310562561766
34.35889894354067
44.47213595499958
54.58257569495584
65.09901951359278
75.48172765326135
85.8309518948453
96.40312423743285
106.4535599249993
117.07106781186548
127.13262084327031
139.06577958030671
149.88153310453261
1510.2469507659596
1611.4017542509914
1711.4598418311182
1811.6940178330753
1913.3570624877570
2014.4913767461894
2115.7578353437117
2216.9019589383961
2317.0056476176366
2418.1562025412358
2518.8275859158113
2621.3614840261249
2725.6656145402072
2827.2256200592315
2928.8332214130526
3035.329307321414
3146.6468241042406
3255.6926787175646
3379.9961033482863
3481.130993735346
35169.088439502579
36506.732949138544


Parameters (Session):
par1 = ward ; par2 = ALL ; par3 = FALSE ; par4 = FALSE ;
Parameters (R input):
par1 = ward ; par2 = ALL ; par3 = FALSE ; par4 = FALSE ;
R code (references can be found in the software module):
par3 <- as.logical(par3)
par4 <- as.logical(par4)
if (par3 == 'TRUE'){
dum = xlab
xlab = ylab
ylab = dum
}
x <- t(y)
hc <- hclust(dist(x),method=par1)
d <- as.dendrogram(hc)
str(d)
mysub <- paste('Method: ',par1)
bitmap(file='test1.png')
if (par4 == 'TRUE'){
plot(d,main=main,ylab=ylab,xlab=xlab,horiz=par3, nodePar=list(pch = c(1,NA), cex=0.8, lab.cex = 0.8),type='t',center=T, sub=mysub)
} else {
plot(d,main=main,ylab=ylab,xlab=xlab,horiz=par3, nodePar=list(pch = c(1,NA), cex=0.8, lab.cex = 0.8), sub=mysub)
}
dev.off()
if (par2 != 'ALL'){
if (par3 == 'TRUE'){
ylab = 'cluster'
} else {
xlab = 'cluster'
}
par2 <- as.numeric(par2)
memb <- cutree(hc, k = par2)
cent <- NULL
for(k in 1:par2){
cent <- rbind(cent, colMeans(x[memb == k, , drop = FALSE]))
}
hc1 <- hclust(dist(cent),method=par1, members = table(memb))
de <- as.dendrogram(hc1)
bitmap(file='test2.png')
if (par4 == 'TRUE'){
plot(de,main=main,ylab=ylab,xlab=xlab,horiz=par3, nodePar=list(pch = c(1,NA), cex=0.8, lab.cex = 0.8),type='t',center=T, sub=mysub)
} else {
plot(de,main=main,ylab=ylab,xlab=xlab,horiz=par3, nodePar=list(pch = c(1,NA), cex=0.8, lab.cex = 0.8), sub=mysub)
}
dev.off()
str(de)
}
load(file='createtable')
a<-table.start()
a<-table.row.start(a)
a<-table.element(a,'Summary of Dendrogram',2,TRUE)
a<-table.row.end(a)
a<-table.row.start(a)
a<-table.element(a,'Label',header=TRUE)
a<-table.element(a,'Height',header=TRUE)
a<-table.row.end(a)
num <- length(x[,1])-1
for (i in 1:num)
{
a<-table.row.start(a)
a<-table.element(a,hc$labels[i])
a<-table.element(a,hc$height[i])
a<-table.row.end(a)
}
a<-table.end(a)
table.save(a,file='mytable1.tab')
if (par2 != 'ALL'){
a<-table.start()
a<-table.row.start(a)
a<-table.element(a,'Summary of Cut Dendrogram',2,TRUE)
a<-table.row.end(a)
a<-table.row.start(a)
a<-table.element(a,'Label',header=TRUE)
a<-table.element(a,'Height',header=TRUE)
a<-table.row.end(a)
num <- par2-1
for (i in 1:num)
{
a<-table.row.start(a)
a<-table.element(a,i)
a<-table.element(a,hc1$height[i])
a<-table.row.end(a)
}
a<-table.end(a)
table.save(a,file='mytable2.tab')
}