Free Statistics

of Irreproducible Research!

Author's title

Author*Unverified author*
R Software Modulerwasp_cloud.wasp
Title produced by softwareTrivariate Scatterplots
Date of computationWed, 12 Nov 2008 06:56:34 -0700
Cite this page as followsStatistical Computations at FreeStatistics.org, Office for Research Development and Education, URL https://freestatistics.org/blog/index.php?v=date/2008/Nov/12/t1226498242zuzfy9q2ojz1tvz.htm/, Retrieved Sun, 19 May 2024 12:16:24 +0000
Statistical Computations at FreeStatistics.org, Office for Research Development and Education, URL https://freestatistics.org/blog/index.php?pk=24193, Retrieved Sun, 19 May 2024 12:16:24 +0000
QR Codes:

Original text written by user:
IsPrivate?No (this computation is public)
User-defined keywords
Estimated Impact173
Family? (F = Feedback message, R = changed R code, M = changed R Module, P = changed Parameters, D = changed Data)
F     [Testing Mean with known Variance - Type II Error] [] [2008-11-12 10:52:51] [d9be4962be2d3234142c279ef29acbcf]
F RMPD    [Trivariate Scatterplots] [] [2008-11-12 13:56:34] [8767719db498704e1fee27044c098ad0] [Current]
Feedback Forum
2008-11-17 13:38:25 [Stef Vermeiren] [reply
De student is vergeten de vermelden dat er duidelijk een positief verband is. De waarden correleren zeer dicht bij het gemiddelde van alle gegevens (aangezien de waarden zich dicht situeren bij de diagonale lijn). Verder werden in het document een aantal delen van de vraag vergeten of geen (aparte) conclusies gesteld, zoals trivariate scatterplot en partial correlatie
2008-11-20 13:50:51 [6066575aa30c0611e452e930b1dff53d] [reply
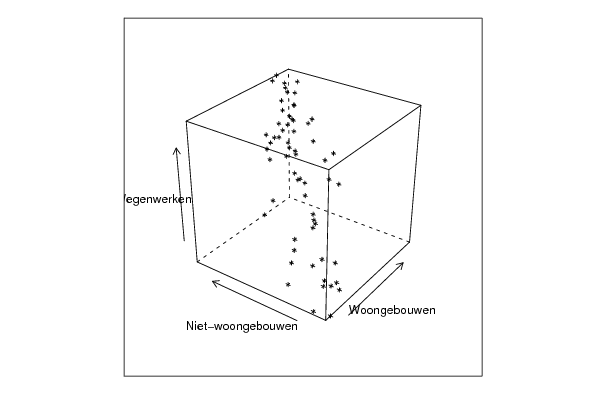
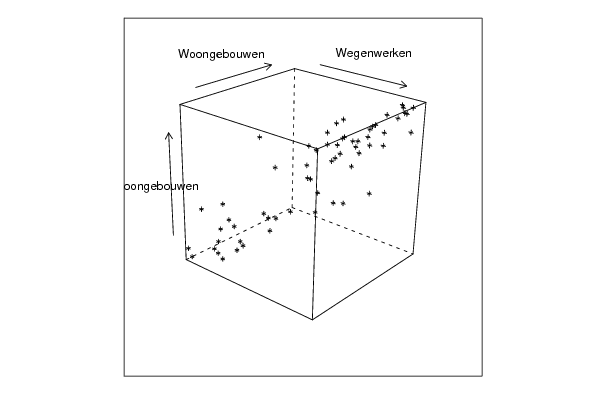
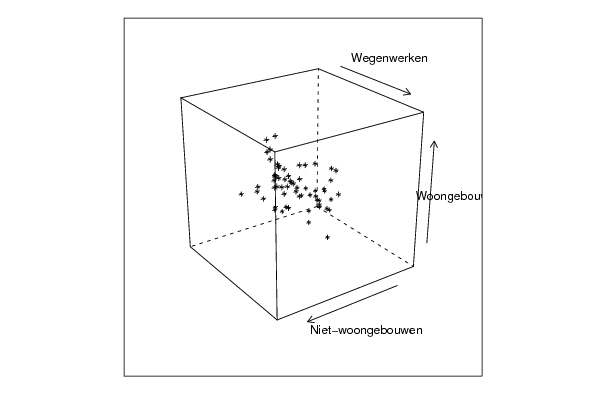
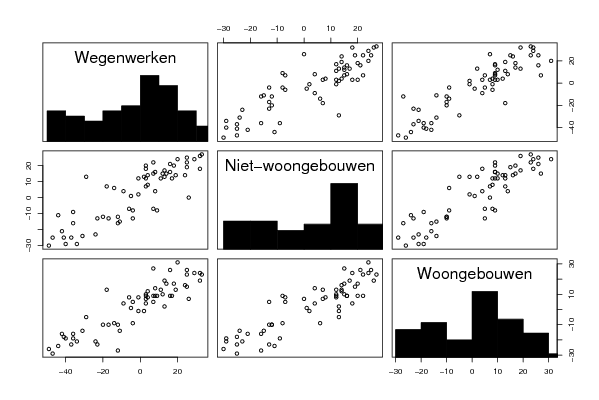
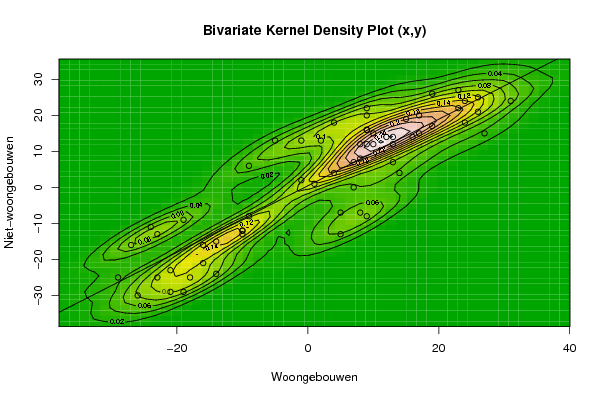
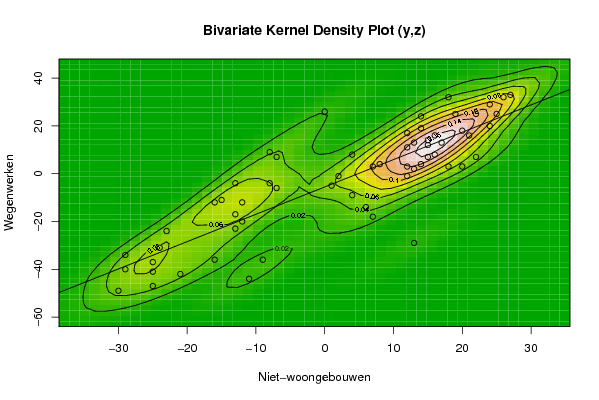
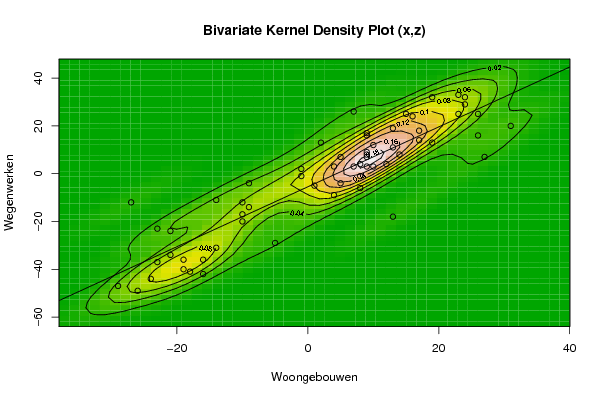
Hier is de student vergeten een aantal grafieken te bespreken. Zo heeft hij de grafieken van kubussen niet besproken en de grafiek van de gestandaardiseerde projecties. Bij de bivariate kernel density van woongebouwen en niet-woongebouwen zien we duidelijk 2 grote clusters. Deze clusters hebben een positief verband. Bij de bivariate kernel density plot van wegenwerken en niet-woongebouwen zien we 1 grote cluster en 3 heel kleine clusters. Uit deze grafiek kunnen we besluiten dat wegenwerken en niet-woongebouwen positief gecorreleerd zijn. Bij de bivariate kernel density plot van wegenwerken en woongebouwen zien we 2 clusters en deze zijn ook positief gecorreleerd. Bij de kubussen kunnen we het verband nagaan tussen de 3 variabelen. Bij elke kubus worden de variabelen op een andere zijde geplaatst zodat we telkens een ander perspectief krijgen. Bij de eerste kubus zien we duidelijk 1 puntenwolk. Bij de tweede kubus zien we deze puntenwolk ook. Bij de derde kubus zien we een iets geconcentreerdere puntenwolk. Bij de gastandaardiseerde projecties zien we duidelijk dat woongebouwen en niet-woongebouwen een sterke lineaire en positieve correlatie hebben. Dit geldt ook voor woongebouwen en wegenwerken. Niet-woongebouwen en wegenwerken hebben een iets minder sterke lineaire positieve correlatie.
2008-11-20 16:18:12 [Gert-Jan Geudens] [reply
Ik ga akkoord met de student. Hij/zij is wel vergeten te vermelden dat we in de 3 bivariate kernell density plots duidelijk een positief verband kunnen opmerken. Dit zien we aan de hand van de positief gerichte ovaal, gevormd door de hoogtelijnen. Dit positief verband lijkt duidelijk de regressielijn te volgen.
2008-11-24 19:34:04 [4679c4d03f1d346a85e79d87ba60ec2b] [reply
Er is geen individuele beoordeling van de grafieken maar wel een vermelding dat deze een lineair verband kennen. In dit geval is het een positief linear verband. Dit is duidelijk zichtbaar op de grafieken en de regressielijnen in de plots. De lichtroze kleur geeft een indicatie dat de waarschijnlijkheid dat ze zich daar bevinden groot is.

Post a new message
Dataseries X:
16
8
-10
-24
-19
8
24
14
7
9
-26
19
15
-1
-10
-21
-14
-27
26
23
5
19
-19
24
17
1
-9
-16
-21
-14
31
27
10
12
-23
13
26
-1
4
-16
-5
9
23
9
2
10
-29
17
9
9
-10
-23
13
13
-9
9
5
8
-18
7
4
Dataseries Y:
14
-7
-13
-11
-9
8
24
4
7
16
-30
26
19
2
-12
-29
-24
-16
25
22
-7
17
-29
18
15
1
6
-21
-23
-15
24
15
15
14
-25
14
21
13
4
-16
13
20
27
-8
13
12
-25
20
22
16
-12
-13
7
12
-8
12
-13
12
-25
0
18
Dataseries Z:
24
-6
-17
-44
-36
4
29
8
3
8
-49
32
25
-1
-20
-34
-31
-12
25
25
7
13
-40
32
14
-5
-14
-42
-24
-11
20
7
12
4
-37
19
16
2
-9
-36
-29
3
33
9
13
3
-47
18
7
16
-12
-23
-18
11
-4
17
-4
-1
-41
26
3


Summary of computational transaction
Raw Inputview raw input (R code)
Raw Outputview raw output of R engine
Computing time5 seconds
R Server'Sir Ronald Aylmer Fisher' @ 193.190.124.24

\begin{tabular}{lllllllll}
\hline
Summary of computational transaction \tabularnewline
Raw Input & view raw input (R code)  \tabularnewline
Raw Output & view raw output of R engine  \tabularnewline
Computing time & 5 seconds \tabularnewline
R Server & 'Sir Ronald Aylmer Fisher' @ 193.190.124.24 \tabularnewline
\hline
\end{tabular}
%Source: https://freestatistics.org/blog/index.php?pk=24193&T=0

[TABLE]
[ROW][C]Summary of computational transaction[/C][/ROW]
[ROW][C]Raw Input[/C][C]view raw input (R code) [/C][/ROW]
[ROW][C]Raw Output[/C][C]view raw output of R engine [/C][/ROW]
[ROW][C]Computing time[/C][C]5 seconds[/C][/ROW]
[ROW][C]R Server[/C][C]'Sir Ronald Aylmer Fisher' @ 193.190.124.24[/C][/ROW]
[/TABLE]
Source: https://freestatistics.org/blog/index.php?pk=24193&T=0

Globally Unique Identifier (entire table): ba.freestatistics.org/blog/index.php?pk=24193&T=0

As an alternative you can also use a QR Code:  

The GUIDs for individual cells are displayed in the table below:

Summary of computational transaction
Raw Inputview raw input (R code)
Raw Outputview raw output of R engine
Computing time5 seconds
R Server'Sir Ronald Aylmer Fisher' @ 193.190.124.24


Parameters (Session):
par1 = 50 ; par2 = 50 ; par3 = Y ; par4 = Y ; par5 = Woongebouwen ; par6 = Niet-woongebouwen ; par7 = Wegenwerken ;
Parameters (R input):
par1 = 50 ; par2 = 50 ; par3 = Y ; par4 = Y ; par5 = Woongebouwen ; par6 = Niet-woongebouwen ; par7 = Wegenwerken ;
R code (references can be found in the software module):
x <- array(x,dim=c(length(x),1))
colnames(x) <- par5
y <- array(y,dim=c(length(y),1))
colnames(y) <- par6
z <- array(z,dim=c(length(z),1))
colnames(z) <- par7
d <- data.frame(cbind(z,y,x))
colnames(d) <- list(par7,par6,par5)
par1 <- as.numeric(par1)
par2 <- as.numeric(par2)
if (par1>500) par1 <- 500
if (par2>500) par2 <- 500
if (par1<10) par1 <- 10
if (par2<10) par2 <- 10
library(GenKern)
library(lattice)
panel.hist <- function(x, ...)
{
usr <- par('usr'); on.exit(par(usr))
par(usr = c(usr[1:2], 0, 1.5) )
h <- hist(x, plot = FALSE)
breaks <- h$breaks; nB <- length(breaks)
y <- h$counts; y <- y/max(y)
rect(breaks[-nB], 0, breaks[-1], y, col='black', ...)
}
bitmap(file='cloud1.png')
cloud(z~x*y, screen = list(x=-45, y=45, z=35),xlab=par5,ylab=par6,zlab=par7)
dev.off()
bitmap(file='cloud2.png')
cloud(z~x*y, screen = list(x=35, y=45, z=25),xlab=par5,ylab=par6,zlab=par7)
dev.off()
bitmap(file='cloud3.png')
cloud(z~x*y, screen = list(x=35, y=-25, z=90),xlab=par5,ylab=par6,zlab=par7)
dev.off()
bitmap(file='pairs.png')
pairs(d,diag.panel=panel.hist)
dev.off()
x <- as.vector(x)
y <- as.vector(y)
z <- as.vector(z)
bitmap(file='bidensity1.png')
op <- KernSur(x,y, xgridsize=par1, ygridsize=par2, correlation=cor(x,y), xbandwidth=dpik(x), ybandwidth=dpik(y))
image(op$xords, op$yords, op$zden, col=terrain.colors(100), axes=TRUE,main='Bivariate Kernel Density Plot (x,y)',xlab=par5,ylab=par6)
if (par3=='Y') contour(op$xords, op$yords, op$zden, add=TRUE)
if (par4=='Y') points(x,y)
(r<-lm(y ~ x))
abline(r)
box()
dev.off()
bitmap(file='bidensity2.png')
op <- KernSur(y,z, xgridsize=par1, ygridsize=par2, correlation=cor(y,z), xbandwidth=dpik(y), ybandwidth=dpik(z))
op
image(op$xords, op$yords, op$zden, col=terrain.colors(100), axes=TRUE,main='Bivariate Kernel Density Plot (y,z)',xlab=par6,ylab=par7)
if (par3=='Y') contour(op$xords, op$yords, op$zden, add=TRUE)
if (par4=='Y') points(y,z)
(r<-lm(z ~ y))
abline(r)
box()
dev.off()
bitmap(file='bidensity3.png')
op <- KernSur(x,z, xgridsize=par1, ygridsize=par2, correlation=cor(x,z), xbandwidth=dpik(x), ybandwidth=dpik(z))
op
image(op$xords, op$yords, op$zden, col=terrain.colors(100), axes=TRUE,main='Bivariate Kernel Density Plot (x,z)',xlab=par5,ylab=par7)
if (par3=='Y') contour(op$xords, op$yords, op$zden, add=TRUE)
if (par4=='Y') points(x,z)
(r<-lm(z ~ x))
abline(r)
box()
dev.off()