Free Statistics

of Irreproducible Research!

Author's title

Author*Unverified author*
R Software Modulerwasp_cloud.wasp
Title produced by softwareTrivariate Scatterplots
Date of computationWed, 12 Nov 2008 06:19:51 -0700
Cite this page as followsStatistical Computations at FreeStatistics.org, Office for Research Development and Education, URL https://freestatistics.org/blog/index.php?v=date/2008/Nov/12/t12264960645konzgi4xanws7f.htm/, Retrieved Sun, 19 May 2024 09:24:50 +0000
Statistical Computations at FreeStatistics.org, Office for Research Development and Education, URL https://freestatistics.org/blog/index.php?pk=24168, Retrieved Sun, 19 May 2024 09:24:50 +0000
QR Codes:

Original text written by user:
IsPrivate?No (this computation is public)
User-defined keywords
Estimated Impact163
Family? (F = Feedback message, R = changed R code, M = changed R Module, P = changed Parameters, D = changed Data)
F       [Trivariate Scatterplots] [Stefan Temmerman] [2008-11-12 13:19:51] [7866e091edc3e3e9f6a037e9d19fcaa2] [Current]
-         [Trivariate Scatterplots] [Various EDA topic...] [2008-11-13 20:43:42] [74be16979710d4c4e7c6647856088456]
-    D    [Trivariate Scatterplots] [Various EDA topic...] [2008-11-13 21:03:39] [74be16979710d4c4e7c6647856088456]
Feedback Forum
2008-11-18 10:05:34 [72e979bcc364082694890d2eccc1a66f] [reply
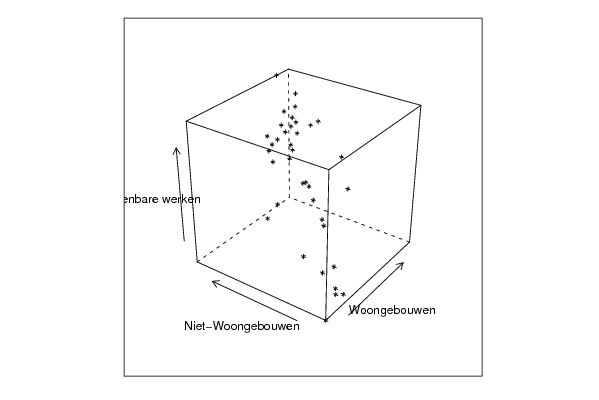
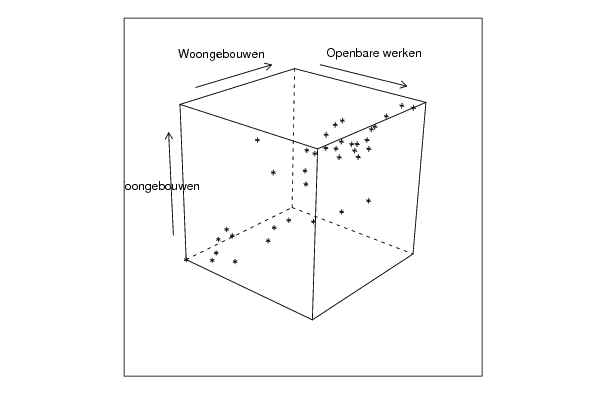
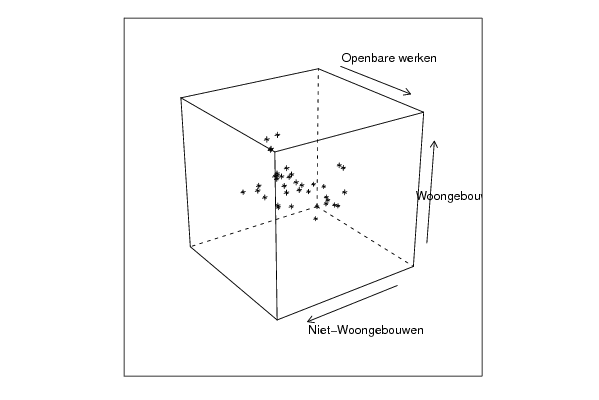
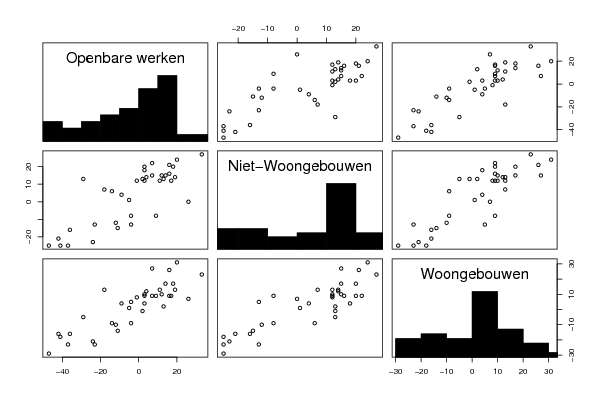
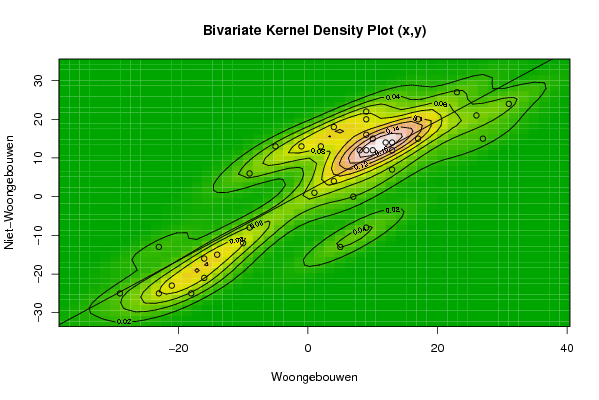
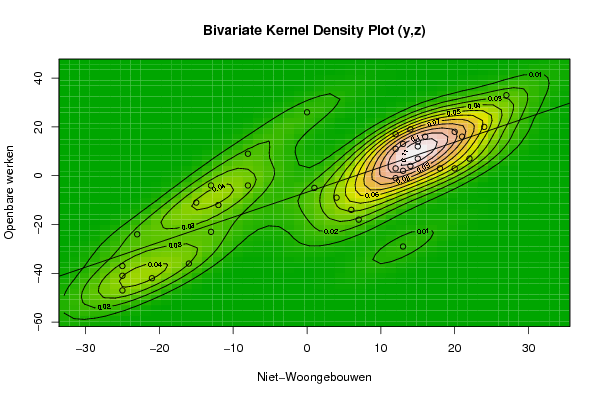
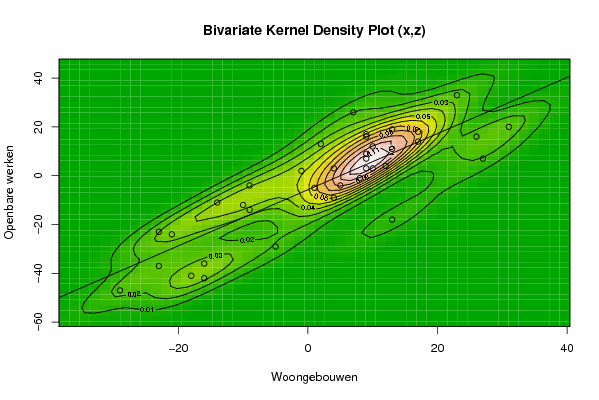
De student heeft enkel de Bivariate Kernel Density Plots gebruikt terwijl er van de Trivariate Scatterplots veel valt af te lezen. Het is namelijk zo dat er tussen alle variabelen een redelijk lineair verband wordt weergegeven. Hiernaast zie je (ook duidelijk bij de Bivariate Kernel Density Plots) dat het een positief verband is.
De student heeft ook geen oordeel gegeven over de voor- of nadelen van deze methodes. Bij de Bivariate Kernel Density Plot is het namelijk zo dat 2 variabelen met elkaar worden vergeleken, bij de Trivariate Scatterplot kan je echter 3 variabelen met elkaar vergelijken wat een duidelijk voordeel is. Het is ook zo dat je bij de Trivariate Scatterplot onmiddellijk ook de Bivariate Kernel Density Plot weergegeven krijgt, waardoor de conclusies makkelijker kunnen getrokken worden omdat je meer figuren ter beschikking hebt.
2008-11-18 14:24:06 [Stefan Temmerman] [reply
Trivariate scatterplot: Deze plot laat in 3 dimensies het verband zien van 3 variabelen tegelijkertijd, wat een voordeel is om conclusies te trekken. De gegevens hier weergegeven kennen een positief stijgend verloop, wat duidt op een correlatie tussen de 3 variabelen.
Bivariate Density plot: Deze plot gebruiken we voor de correlatie visueel waar te nemen tussen (maar) 2 variabelen, en dat de rechte (regressielijn) de beste visualisatie is van al de punten. Hier zijn de gegevens meer ellipsvormig dan cirkelvormig, wat wijst op een verband.
2008-11-24 21:01:22 [5faab2fc6fb120339944528a32d48a04] [reply
In de trivariate scatterplots wil men de samenhang van 3variabelen weergeven. De kubussen geven de correlatie vanuit verschillende oogpunten. In de 2D afbeelding gaan echter gegevens verloren door reductie van de 3de variabele. Bij deze voorstelling stellen we een positief verband vast vermits de punten in een stijgende lijn liggen.Toch verschild de samenhang. Dit kunnen we afleiden uit de verschillende clusters en de omringende hoogtelijnen

Post a new message
Dataseries X:
17
1
-9
-16
-21
-14
31
27
10
12
-23
13
26
-1
4
-16
-5
9
23
9
2
10
-29
17
9
9
-10
-23
13
13
-9
9
5
8
-18
7
4
Dataseries Y:
15
1
6
-21
-23
-15
24
15
15
14
-25
14
21
13
4
-16
13
20
27
-8
13
12
-25
20
22
16
-12
-13
7
12
-8
12
-13
12
-25
0
18
Dataseries Z:
14
-5
-14
-42
-24
-11
20
7
12
4
-37
19
16
2
-9
-36
-29
3
33
9
13
3
-47
18
7
16
-12
-23
-18
11
-4
17
-4
-1
-41
26
3


Summary of computational transaction
Raw Inputview raw input (R code)
Raw Outputview raw output of R engine
Computing time5 seconds
R Server'Sir Ronald Aylmer Fisher' @ 193.190.124.24

\begin{tabular}{lllllllll}
\hline
Summary of computational transaction \tabularnewline
Raw Input & view raw input (R code)  \tabularnewline
Raw Output & view raw output of R engine  \tabularnewline
Computing time & 5 seconds \tabularnewline
R Server & 'Sir Ronald Aylmer Fisher' @ 193.190.124.24 \tabularnewline
\hline
\end{tabular}
%Source: https://freestatistics.org/blog/index.php?pk=24168&T=0

[TABLE]
[ROW][C]Summary of computational transaction[/C][/ROW]
[ROW][C]Raw Input[/C][C]view raw input (R code) [/C][/ROW]
[ROW][C]Raw Output[/C][C]view raw output of R engine [/C][/ROW]
[ROW][C]Computing time[/C][C]5 seconds[/C][/ROW]
[ROW][C]R Server[/C][C]'Sir Ronald Aylmer Fisher' @ 193.190.124.24[/C][/ROW]
[/TABLE]
Source: https://freestatistics.org/blog/index.php?pk=24168&T=0

Globally Unique Identifier (entire table): ba.freestatistics.org/blog/index.php?pk=24168&T=0

As an alternative you can also use a QR Code:  

The GUIDs for individual cells are displayed in the table below:

Summary of computational transaction
Raw Inputview raw input (R code)
Raw Outputview raw output of R engine
Computing time5 seconds
R Server'Sir Ronald Aylmer Fisher' @ 193.190.124.24


Parameters (Session):
par1 = 50 ; par2 = 50 ; par3 = Y ; par4 = Y ; par5 = Woongebouwen ; par6 = Niet-Woongebouwen ; par7 = Openbare werken ;
Parameters (R input):
par1 = 50 ; par2 = 50 ; par3 = Y ; par4 = Y ; par5 = Woongebouwen ; par6 = Niet-Woongebouwen ; par7 = Openbare werken ;
R code (references can be found in the software module):
x <- array(x,dim=c(length(x),1))
colnames(x) <- par5
y <- array(y,dim=c(length(y),1))
colnames(y) <- par6
z <- array(z,dim=c(length(z),1))
colnames(z) <- par7
d <- data.frame(cbind(z,y,x))
colnames(d) <- list(par7,par6,par5)
par1 <- as.numeric(par1)
par2 <- as.numeric(par2)
if (par1>500) par1 <- 500
if (par2>500) par2 <- 500
if (par1<10) par1 <- 10
if (par2<10) par2 <- 10
library(GenKern)
library(lattice)
panel.hist <- function(x, ...)
{
usr <- par('usr'); on.exit(par(usr))
par(usr = c(usr[1:2], 0, 1.5) )
h <- hist(x, plot = FALSE)
breaks <- h$breaks; nB <- length(breaks)
y <- h$counts; y <- y/max(y)
rect(breaks[-nB], 0, breaks[-1], y, col='black', ...)
}
bitmap(file='cloud1.png')
cloud(z~x*y, screen = list(x=-45, y=45, z=35),xlab=par5,ylab=par6,zlab=par7)
dev.off()
bitmap(file='cloud2.png')
cloud(z~x*y, screen = list(x=35, y=45, z=25),xlab=par5,ylab=par6,zlab=par7)
dev.off()
bitmap(file='cloud3.png')
cloud(z~x*y, screen = list(x=35, y=-25, z=90),xlab=par5,ylab=par6,zlab=par7)
dev.off()
bitmap(file='pairs.png')
pairs(d,diag.panel=panel.hist)
dev.off()
x <- as.vector(x)
y <- as.vector(y)
z <- as.vector(z)
bitmap(file='bidensity1.png')
op <- KernSur(x,y, xgridsize=par1, ygridsize=par2, correlation=cor(x,y), xbandwidth=dpik(x), ybandwidth=dpik(y))
image(op$xords, op$yords, op$zden, col=terrain.colors(100), axes=TRUE,main='Bivariate Kernel Density Plot (x,y)',xlab=par5,ylab=par6)
if (par3=='Y') contour(op$xords, op$yords, op$zden, add=TRUE)
if (par4=='Y') points(x,y)
(r<-lm(y ~ x))
abline(r)
box()
dev.off()
bitmap(file='bidensity2.png')
op <- KernSur(y,z, xgridsize=par1, ygridsize=par2, correlation=cor(y,z), xbandwidth=dpik(y), ybandwidth=dpik(z))
op
image(op$xords, op$yords, op$zden, col=terrain.colors(100), axes=TRUE,main='Bivariate Kernel Density Plot (y,z)',xlab=par6,ylab=par7)
if (par3=='Y') contour(op$xords, op$yords, op$zden, add=TRUE)
if (par4=='Y') points(y,z)
(r<-lm(z ~ y))
abline(r)
box()
dev.off()
bitmap(file='bidensity3.png')
op <- KernSur(x,z, xgridsize=par1, ygridsize=par2, correlation=cor(x,z), xbandwidth=dpik(x), ybandwidth=dpik(z))
op
image(op$xords, op$yords, op$zden, col=terrain.colors(100), axes=TRUE,main='Bivariate Kernel Density Plot (x,z)',xlab=par5,ylab=par7)
if (par3=='Y') contour(op$xords, op$yords, op$zden, add=TRUE)
if (par4=='Y') points(x,z)
(r<-lm(z ~ x))
abline(r)
box()
dev.off()