Free Statistics

of Irreproducible Research!

Author's title

Author*The author of this computation has been verified*
R Software Modulerwasp_hierarchicalclustering.wasp
Title produced by softwareHierarchical Clustering
Date of computationWed, 12 Nov 2008 05:08:49 -0700
Cite this page as followsStatistical Computations at FreeStatistics.org, Office for Research Development and Education, URL https://freestatistics.org/blog/index.php?v=date/2008/Nov/12/t1226491825v0pag9v3gw4z5u7.htm/, Retrieved Sun, 19 May 2024 09:25:22 +0000
Statistical Computations at FreeStatistics.org, Office for Research Development and Education, URL https://freestatistics.org/blog/index.php?pk=24148, Retrieved Sun, 19 May 2024 09:25:22 +0000
QR Codes:

Original text written by user:
IsPrivate?No (this computation is public)
User-defined keywords
Estimated Impact158
Family? (F = Feedback message, R = changed R code, M = changed R Module, P = changed Parameters, D = changed Data)
F       [Hierarchical Clustering] [Cluster vorming (Q2)] [2008-11-12 12:08:49] [c5d6d05aee6be5527ac4a30a8c3b8fe5] [Current]
Feedback Forum
2008-11-18 13:35:25 [Julie Govaerts] [reply
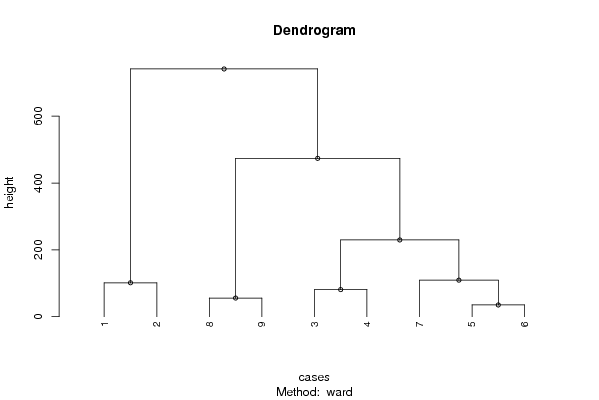
Dendogram --> maakt in periodes groepen die gelijkaardig zijn = de tijdsreeks wordt gesplitst
eerder een exploratief instrument (bv voor in de marketing = welke producten horen samen in 1 groep?)

hier zie je dat de grootte van de groepen ongeveer gelijk is, de gegevens zijn verdeeld in 4à5 ongeveer gelijke groepen
2008-11-22 14:35:41 [c00776cbed2786c9c4960950021bd861] [reply
Bij hierarchical clustering worrdt de tijdreeks opgesplitst. Het begint bij een splitsing in 2 delen en wordt dan weer verder gesplitst.
Zoals je ziet op de tekening zijn de gegevens in de clusters (vb. 1 en 2) van gelijkaardige periodes.
Hier in de grafiek zijn er 5 clusters, dus 5 groepen van gelijkaardige periodes.
De meeste clusters bevatten telkens 2 groepen.
2008-11-24 14:33:30 [Ellen Van den Broeck] [reply
Bij een dendogram worden de gegevens geclusterd. Eerst in 2 groepen.
Het is een louter exploratief experiment.
2008-11-24 21:54:39 [Erik Geysen] [reply
De student heeft hier de dendrogram gebruikt. Dit is ook juist. Het voordeel van de dendrogram is dat men een tijdsreeks kan opsplitsen in verschillende groepen. Zo zien we welke gegevens in een eerste deel zitten en de andere gegevens in een tweede deel. Het gevolg is dat we kunnen zien welke gegevens anders behandeld moeten worden.
Deze groepen kunnen dan weer onderverdeeld worden. Hier zien we 5 clusters, wat wil zeggen dat er 5 gelijkaardige periodes zijn.

Post a new message
Dataseries X:
6942	4931	4343
6879	4879	4283
6835	4804	4227
6805	4735	4197
6774	4685	4194
6743	4670	4200
6724	4616	4142
6715	4569	4061
6709	4550	4009


Summary of computational transaction
Raw Inputview raw input (R code)
Raw Outputview raw output of R engine
Computing time5 seconds
R Server'Herman Ole Andreas Wold' @ 193.190.124.10:1001

\begin{tabular}{lllllllll}
\hline
Summary of computational transaction \tabularnewline
Raw Input & view raw input (R code)  \tabularnewline
Raw Output & view raw output of R engine  \tabularnewline
Computing time & 5 seconds \tabularnewline
R Server & 'Herman Ole Andreas Wold' @ 193.190.124.10:1001 \tabularnewline
\hline
\end{tabular}
%Source: https://freestatistics.org/blog/index.php?pk=24148&T=0

[TABLE]
[ROW][C]Summary of computational transaction[/C][/ROW]
[ROW][C]Raw Input[/C][C]view raw input (R code) [/C][/ROW]
[ROW][C]Raw Output[/C][C]view raw output of R engine [/C][/ROW]
[ROW][C]Computing time[/C][C]5 seconds[/C][/ROW]
[ROW][C]R Server[/C][C]'Herman Ole Andreas Wold' @ 193.190.124.10:1001[/C][/ROW]
[/TABLE]
Source: https://freestatistics.org/blog/index.php?pk=24148&T=0

Globally Unique Identifier (entire table): ba.freestatistics.org/blog/index.php?pk=24148&T=0

As an alternative you can also use a QR Code:  

The GUIDs for individual cells are displayed in the table below:

Summary of computational transaction
Raw Inputview raw input (R code)
Raw Outputview raw output of R engine
Computing time5 seconds
R Server'Herman Ole Andreas Wold' @ 193.190.124.10:1001


Summary of Dendrogram
LabelHeight
134.9571165858971
255.6866231693034
381
4101.355808910984
5109.225746160675
6229.597237379338
7473.84205864975
8741.433729894195

\begin{tabular}{lllllllll}
\hline
Summary of Dendrogram \tabularnewline
Label & Height \tabularnewline
1 & 34.9571165858971 \tabularnewline
2 & 55.6866231693034 \tabularnewline
3 & 81 \tabularnewline
4 & 101.355808910984 \tabularnewline
5 & 109.225746160675 \tabularnewline
6 & 229.597237379338 \tabularnewline
7 & 473.84205864975 \tabularnewline
8 & 741.433729894195 \tabularnewline
\hline
\end{tabular}
%Source: https://freestatistics.org/blog/index.php?pk=24148&T=1

[TABLE]
[ROW][C]Summary of Dendrogram[/C][/ROW]
[ROW][C]Label[/C][C]Height[/C][/ROW]
[ROW][C]1[/C][C]34.9571165858971[/C][/ROW]
[ROW][C]2[/C][C]55.6866231693034[/C][/ROW]
[ROW][C]3[/C][C]81[/C][/ROW]
[ROW][C]4[/C][C]101.355808910984[/C][/ROW]
[ROW][C]5[/C][C]109.225746160675[/C][/ROW]
[ROW][C]6[/C][C]229.597237379338[/C][/ROW]
[ROW][C]7[/C][C]473.84205864975[/C][/ROW]
[ROW][C]8[/C][C]741.433729894195[/C][/ROW]
[/TABLE]
Source: https://freestatistics.org/blog/index.php?pk=24148&T=1

Globally Unique Identifier (entire table): ba.freestatistics.org/blog/index.php?pk=24148&T=1

As an alternative you can also use a QR Code:  

The GUIDs for individual cells are displayed in the table below:

Summary of Dendrogram
LabelHeight
134.9571165858971
255.6866231693034
381
4101.355808910984
5109.225746160675
6229.597237379338
7473.84205864975
8741.433729894195


Parameters (Session):
par1 = ward ; par2 = ALL ; par3 = FALSE ; par4 = FALSE ;
Parameters (R input):
par1 = ward ; par2 = ALL ; par3 = FALSE ; par4 = FALSE ;
R code (references can be found in the software module):
par3 <- as.logical(par3)
par4 <- as.logical(par4)
if (par3 == 'TRUE'){
dum = xlab
xlab = ylab
ylab = dum
}
x <- t(y)
hc <- hclust(dist(x),method=par1)
d <- as.dendrogram(hc)
str(d)
mysub <- paste('Method: ',par1)
bitmap(file='test1.png')
if (par4 == 'TRUE'){
plot(d,main=main,ylab=ylab,xlab=xlab,horiz=par3, nodePar=list(pch = c(1,NA), cex=0.8, lab.cex = 0.8),type='t',center=T, sub=mysub)
} else {
plot(d,main=main,ylab=ylab,xlab=xlab,horiz=par3, nodePar=list(pch = c(1,NA), cex=0.8, lab.cex = 0.8), sub=mysub)
}
dev.off()
if (par2 != 'ALL'){
if (par3 == 'TRUE'){
ylab = 'cluster'
} else {
xlab = 'cluster'
}
par2 <- as.numeric(par2)
memb <- cutree(hc, k = par2)
cent <- NULL
for(k in 1:par2){
cent <- rbind(cent, colMeans(x[memb == k, , drop = FALSE]))
}
hc1 <- hclust(dist(cent),method=par1, members = table(memb))
de <- as.dendrogram(hc1)
bitmap(file='test2.png')
if (par4 == 'TRUE'){
plot(de,main=main,ylab=ylab,xlab=xlab,horiz=par3, nodePar=list(pch = c(1,NA), cex=0.8, lab.cex = 0.8),type='t',center=T, sub=mysub)
} else {
plot(de,main=main,ylab=ylab,xlab=xlab,horiz=par3, nodePar=list(pch = c(1,NA), cex=0.8, lab.cex = 0.8), sub=mysub)
}
dev.off()
str(de)
}
load(file='createtable')
a<-table.start()
a<-table.row.start(a)
a<-table.element(a,'Summary of Dendrogram',2,TRUE)
a<-table.row.end(a)
a<-table.row.start(a)
a<-table.element(a,'Label',header=TRUE)
a<-table.element(a,'Height',header=TRUE)
a<-table.row.end(a)
num <- length(x[,1])-1
for (i in 1:num)
{
a<-table.row.start(a)
a<-table.element(a,hc$labels[i])
a<-table.element(a,hc$height[i])
a<-table.row.end(a)
}
a<-table.end(a)
table.save(a,file='mytable1.tab')
if (par2 != 'ALL'){
a<-table.start()
a<-table.row.start(a)
a<-table.element(a,'Summary of Cut Dendrogram',2,TRUE)
a<-table.row.end(a)
a<-table.row.start(a)
a<-table.element(a,'Label',header=TRUE)
a<-table.element(a,'Height',header=TRUE)
a<-table.row.end(a)
num <- par2-1
for (i in 1:num)
{
a<-table.row.start(a)
a<-table.element(a,i)
a<-table.element(a,hc1$height[i])
a<-table.row.end(a)
}
a<-table.end(a)
table.save(a,file='mytable2.tab')
}