Free Statistics

of Irreproducible Research!

Author's title

Author*Unverified author*
R Software Modulerwasp_hierarchicalclustering.wasp
Title produced by softwareHierarchical Clustering
Date of computationWed, 12 Nov 2008 05:01:04 -0700
Cite this page as followsStatistical Computations at FreeStatistics.org, Office for Research Development and Education, URL https://freestatistics.org/blog/index.php?v=date/2008/Nov/12/t1226491364xjv66lw0cibo67y.htm/, Retrieved Sun, 19 May 2024 10:10:39 +0000
Statistical Computations at FreeStatistics.org, Office for Research Development and Education, URL https://freestatistics.org/blog/index.php?pk=24139, Retrieved Sun, 19 May 2024 10:10:39 +0000
QR Codes:

Original text written by user:
IsPrivate?No (this computation is public)
User-defined keywords
Estimated Impact151
Family? (F = Feedback message, R = changed R code, M = changed R Module, P = changed Parameters, D = changed Data)
F       [Hierarchical Clustering] [opdracht8.3 vario...] [2008-11-12 12:01:04] [0cebda6bbc99948f606f5db2560512ab] [Current]
Feedback Forum
2008-11-15 12:10:19 [58d427c57bd46519a715a3a7fea6a80f] [reply
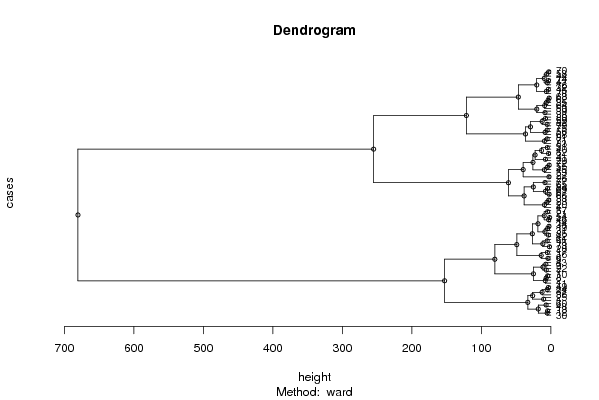
De dendrogram geeft weer: in bepaalde periodes zijn er groepen gemaakt die gelijkaardig zijn . Elke cluster werd opnieuw onderverdeeld tot op1 enkele periode.
2008-11-15 14:37:13 [Philip Van Herck] [reply
Volgens mij moeten de periodes niet opgenomen worden in de dataset. Enkel de waarnemingen moeten hier geplakt worden. Men krijgt dan ook een heel andere dendogram. Deze dendogram geeft dan weer welke waarnemingen samengenomen kunnen worden. De waarnemingen in de verschillende ondervedelingen (takken) hebben een zeker verband. Op het einde van de dendogram kunnen we aflezen welke waarnemingen (aan de hand van rangnummer dat overeenkomt met de periodes) uit welke tak voorkomt. We kunnen zo ook zien dat bepaalde periodieke fenomenen naar voren komen.
2008-11-18 11:20:08 [407693b66d7f2e0b350979005057872d] [reply
Q2

Dit antwoord is niet helemaal correct. Een cluster zoals een dendrogram vertrekken twee takken uit het eerste knooppunt. Alle takken die vertrekken uit de eerste tak zijn gelijkaardig dat wil zeggen dat de eerste maanden vanuit het dendrogram bekeken anders zijn dan de volgende maanden(maanden die zich in de tweede cluster bevinden

Post a new message
Dataseries X:
31/08/2001	90.7	78.4	97.8
30/09/2001	94.3	114.6	107.4
31/10/2001	104.6	113.3	117.5
30/11/2001	111.1	117	105.6
31/12/2001	110.8	99.6	97.4
31/01/2002	107.2	99.4	99.5
28/02/2002	99	101.9	98
31/03/2002	99	115.2	104.3
30/04/2002	91	108.5	100.6
31/05/2002	96.2	113.8	101.1
30/06/2002	96.9	121	103.9
31/07/2002	96.2	92.2	96.9
31/08/2002	100.1	90.2	95.5
30/09/2002	99	101.5	108.4
31/10/2002	115.4	126.6	117
30/11/2002	106.9	93.9	103.8
31/12/2002	107.1	89.8	100.8
31/01/2003	99.3	93.4	110.6
28/02/2003	99.2	101.5	104
31/03/2003	108.3	110.4	112.6
30/04/2003	105.6	105.9	107.3
31/05/2003	99.5	108.4	98.9
30/06/2003	107.4	113.9	109.8
31/07/2003	93.1	86.1	104.9
31/08/2003	88.1	69.4	102.2
30/09/2003	110.7	101.2	123.9
31/10/2003	113.1	100.5	124.9
30/11/2003	99.6	98	112.7
31/12/2003	93.6	106.6	121.9
31/01/2004	98.6	90.1	100.6
29/02/2004	99.6	96.9	104.3
31/03/2004	114.3	125.9	120.4
30/04/2004	107.8	112	107.5
31/05/2004	101.2	100	102.9
30/06/2004	112.5	123.9	125.6
31/07/2004	100.5	79.8	107.5
31/08/2004	93.9	83.4	108.8
30/09/2004	116.2	113.6	128.4
31/10/2004	112	112.9	121.1
30/11/2004	106.4	104	119.5
31/12/2004	95.7	109.9	128.7
31/01/2005	96	99	108.7
28/02/2005	95.8	106.3	105.5
31/03/2005	103	128.9	119.8
30/04/2005	102.2	111.1	111.3
31/05/2005	98.4	102.9	110.6
30/06/2005	111.4	130	120.1
31/07/2005	86.6	87	97.5
31/08/2005	91.3	87.5	107.7
30/09/2005	107.9	117.6	127.3
31/10/2005	101.8	103.4	117.2
30/11/2005	104.4	110.8	119.8
31/12/2005	93.4	112.6	116.2
31/01/2006	100.1	102.5	111
28/02/2006	98.5	112.4	112.4
31/03/2006	112.9	135.6	130.6
30/04/2006	101.4	105.1	109.1
31/05/2006	107.1	127.7	118.8
30/06/2006	110.8	137	123.9
31/07/2006	90.3	91	101.6
31/08/2006	95.5	90.5	112.8
30/09/2006	111.4	122.4	128
31/10/2006	113	123.3	129.6
30/11/2006	107.5	124.3	125.8
31/12/2006	95.9	120	119.5
31/01/2007	106.3	118.1	115.7
28/02/2007	105.2	119	113.6
31/03/2007	117.2	142.7	129.7
30/04/2007	106.9	123.6	112
31/05/2007	108.2	129.6	116.8
30/06/2007	113	151.6	127
31/07/2007	97.2	110.4	112.1
31/08/2007	99.9	99.2	114.2
30/09/2007	108.1	130.5	121.1
31/10/2007	118.1	136.2	131.6
30/11/2007	109.1	129.7	125
31/12/2007	93.3	128	120.4
31/01/2008	112.1	121.6	117.7
29/02/2008	111.8	135.8	117.5
31/03/2008	112.5	143.8	120.6
30/04/2008	116.3	147.5	127.5
31/05/2008	110.3	136.2	112.3
30/06/2008	117.1	156.6	124.5
31/07/2008	103.4	123.3	115.2
31/08/2008	96.2	100.4	105.4


Summary of computational transaction
Raw Inputview raw input (R code)
Raw Outputview raw output of R engine
Computing time2 seconds
R Server'Gwilym Jenkins' @ 72.249.127.135

\begin{tabular}{lllllllll}
\hline
Summary of computational transaction \tabularnewline
Raw Input & view raw input (R code)  \tabularnewline
Raw Output & view raw output of R engine  \tabularnewline
Computing time & 2 seconds \tabularnewline
R Server & 'Gwilym Jenkins' @ 72.249.127.135 \tabularnewline
\hline
\end{tabular}
%Source: https://freestatistics.org/blog/index.php?pk=24139&T=0

[TABLE]
[ROW][C]Summary of computational transaction[/C][/ROW]
[ROW][C]Raw Input[/C][C]view raw input (R code) [/C][/ROW]
[ROW][C]Raw Output[/C][C]view raw output of R engine [/C][/ROW]
[ROW][C]Computing time[/C][C]2 seconds[/C][/ROW]
[ROW][C]R Server[/C][C]'Gwilym Jenkins' @ 72.249.127.135[/C][/ROW]
[/TABLE]
Source: https://freestatistics.org/blog/index.php?pk=24139&T=0

Globally Unique Identifier (entire table): ba.freestatistics.org/blog/index.php?pk=24139&T=0

As an alternative you can also use a QR Code:  

The GUIDs for individual cells are displayed in the table below:

Summary of computational transaction
Raw Inputview raw input (R code)
Raw Outputview raw output of R engine
Computing time2 seconds
R Server'Gwilym Jenkins' @ 72.249.127.135


Summary of Dendrogram
LabelHeight
11.79168992949735
21.94422229282815
32.40416779297055
42.43515913515519
52.535758613688
62.6925824060872
72.73130283500468
82.96984848098390
93.00998364666029
103.18333374323805
113.40293991068268
123.4842503775909
133.59029011408157
143.61109402777765
153.64143007854879
163.92960181467499
174.17255334960276
184.47660633321512
194.60108683643955
204.63896540190065
214.68028947805942
224.75184199499103
235.08428952806283
245.17783738971267
255.1893363725513
265.26214627972185
275.26741047141656
285.28677610146172
295.32183410642805
305.3218731788598
315.32916625821537
325.42678699467211
335.62339142119244
345.96437605691548
356.49628545269212
366.58103450771045
376.70171900091033
386.73058613694655
396.81909084849301
407.20347211236167
417.7150883321705
427.74725803374203
437.8447434629821
448.0466120504973
458.3441425108843
468.45103544032073
478.45990543682378
488.56939387663422
498.91282492113824
509.1933168150248
519.26949089206632
529.3454961405434
539.50012946557253
549.54430973502844
5510.3498792263487
5611.3471868144622
5711.5547179514600
5812.5635840995395
5912.6110661251402
6013.3754496768022
6113.9241416568346
6218.0991828471803
6318.4946525129736
6420.2376117206061
6520.2986371456707
6622.675989995303
6725.0714082712866
6825.2296929088941
6925.7177979187179
7026.2352251129129
7126.6461161159687
7229.3347350238217
7333.2167887544979
7436.5136666427946
7538.5075635155270
7639.8461725290528
7746.8151583875458
7849.0341339285924
7961.0424208159177
8080.6472601342296
81121.547205342734
82152.920783915421
83255.062315074147
84680.616476883125

\begin{tabular}{lllllllll}
\hline
Summary of Dendrogram \tabularnewline
Label & Height \tabularnewline
1 & 1.79168992949735 \tabularnewline
2 & 1.94422229282815 \tabularnewline
3 & 2.40416779297055 \tabularnewline
4 & 2.43515913515519 \tabularnewline
5 & 2.535758613688 \tabularnewline
6 & 2.6925824060872 \tabularnewline
7 & 2.73130283500468 \tabularnewline
8 & 2.96984848098390 \tabularnewline
9 & 3.00998364666029 \tabularnewline
10 & 3.18333374323805 \tabularnewline
11 & 3.40293991068268 \tabularnewline
12 & 3.4842503775909 \tabularnewline
13 & 3.59029011408157 \tabularnewline
14 & 3.61109402777765 \tabularnewline
15 & 3.64143007854879 \tabularnewline
16 & 3.92960181467499 \tabularnewline
17 & 4.17255334960276 \tabularnewline
18 & 4.47660633321512 \tabularnewline
19 & 4.60108683643955 \tabularnewline
20 & 4.63896540190065 \tabularnewline
21 & 4.68028947805942 \tabularnewline
22 & 4.75184199499103 \tabularnewline
23 & 5.08428952806283 \tabularnewline
24 & 5.17783738971267 \tabularnewline
25 & 5.1893363725513 \tabularnewline
26 & 5.26214627972185 \tabularnewline
27 & 5.26741047141656 \tabularnewline
28 & 5.28677610146172 \tabularnewline
29 & 5.32183410642805 \tabularnewline
30 & 5.3218731788598 \tabularnewline
31 & 5.32916625821537 \tabularnewline
32 & 5.42678699467211 \tabularnewline
33 & 5.62339142119244 \tabularnewline
34 & 5.96437605691548 \tabularnewline
35 & 6.49628545269212 \tabularnewline
36 & 6.58103450771045 \tabularnewline
37 & 6.70171900091033 \tabularnewline
38 & 6.73058613694655 \tabularnewline
39 & 6.81909084849301 \tabularnewline
40 & 7.20347211236167 \tabularnewline
41 & 7.7150883321705 \tabularnewline
42 & 7.74725803374203 \tabularnewline
43 & 7.8447434629821 \tabularnewline
44 & 8.0466120504973 \tabularnewline
45 & 8.3441425108843 \tabularnewline
46 & 8.45103544032073 \tabularnewline
47 & 8.45990543682378 \tabularnewline
48 & 8.56939387663422 \tabularnewline
49 & 8.91282492113824 \tabularnewline
50 & 9.1933168150248 \tabularnewline
51 & 9.26949089206632 \tabularnewline
52 & 9.3454961405434 \tabularnewline
53 & 9.50012946557253 \tabularnewline
54 & 9.54430973502844 \tabularnewline
55 & 10.3498792263487 \tabularnewline
56 & 11.3471868144622 \tabularnewline
57 & 11.5547179514600 \tabularnewline
58 & 12.5635840995395 \tabularnewline
59 & 12.6110661251402 \tabularnewline
60 & 13.3754496768022 \tabularnewline
61 & 13.9241416568346 \tabularnewline
62 & 18.0991828471803 \tabularnewline
63 & 18.4946525129736 \tabularnewline
64 & 20.2376117206061 \tabularnewline
65 & 20.2986371456707 \tabularnewline
66 & 22.675989995303 \tabularnewline
67 & 25.0714082712866 \tabularnewline
68 & 25.2296929088941 \tabularnewline
69 & 25.7177979187179 \tabularnewline
70 & 26.2352251129129 \tabularnewline
71 & 26.6461161159687 \tabularnewline
72 & 29.3347350238217 \tabularnewline
73 & 33.2167887544979 \tabularnewline
74 & 36.5136666427946 \tabularnewline
75 & 38.5075635155270 \tabularnewline
76 & 39.8461725290528 \tabularnewline
77 & 46.8151583875458 \tabularnewline
78 & 49.0341339285924 \tabularnewline
79 & 61.0424208159177 \tabularnewline
80 & 80.6472601342296 \tabularnewline
81 & 121.547205342734 \tabularnewline
82 & 152.920783915421 \tabularnewline
83 & 255.062315074147 \tabularnewline
84 & 680.616476883125 \tabularnewline
\hline
\end{tabular}
%Source: https://freestatistics.org/blog/index.php?pk=24139&T=1

[TABLE]
[ROW][C]Summary of Dendrogram[/C][/ROW]
[ROW][C]Label[/C][C]Height[/C][/ROW]
[ROW][C]1[/C][C]1.79168992949735[/C][/ROW]
[ROW][C]2[/C][C]1.94422229282815[/C][/ROW]
[ROW][C]3[/C][C]2.40416779297055[/C][/ROW]
[ROW][C]4[/C][C]2.43515913515519[/C][/ROW]
[ROW][C]5[/C][C]2.535758613688[/C][/ROW]
[ROW][C]6[/C][C]2.6925824060872[/C][/ROW]
[ROW][C]7[/C][C]2.73130283500468[/C][/ROW]
[ROW][C]8[/C][C]2.96984848098390[/C][/ROW]
[ROW][C]9[/C][C]3.00998364666029[/C][/ROW]
[ROW][C]10[/C][C]3.18333374323805[/C][/ROW]
[ROW][C]11[/C][C]3.40293991068268[/C][/ROW]
[ROW][C]12[/C][C]3.4842503775909[/C][/ROW]
[ROW][C]13[/C][C]3.59029011408157[/C][/ROW]
[ROW][C]14[/C][C]3.61109402777765[/C][/ROW]
[ROW][C]15[/C][C]3.64143007854879[/C][/ROW]
[ROW][C]16[/C][C]3.92960181467499[/C][/ROW]
[ROW][C]17[/C][C]4.17255334960276[/C][/ROW]
[ROW][C]18[/C][C]4.47660633321512[/C][/ROW]
[ROW][C]19[/C][C]4.60108683643955[/C][/ROW]
[ROW][C]20[/C][C]4.63896540190065[/C][/ROW]
[ROW][C]21[/C][C]4.68028947805942[/C][/ROW]
[ROW][C]22[/C][C]4.75184199499103[/C][/ROW]
[ROW][C]23[/C][C]5.08428952806283[/C][/ROW]
[ROW][C]24[/C][C]5.17783738971267[/C][/ROW]
[ROW][C]25[/C][C]5.1893363725513[/C][/ROW]
[ROW][C]26[/C][C]5.26214627972185[/C][/ROW]
[ROW][C]27[/C][C]5.26741047141656[/C][/ROW]
[ROW][C]28[/C][C]5.28677610146172[/C][/ROW]
[ROW][C]29[/C][C]5.32183410642805[/C][/ROW]
[ROW][C]30[/C][C]5.3218731788598[/C][/ROW]
[ROW][C]31[/C][C]5.32916625821537[/C][/ROW]
[ROW][C]32[/C][C]5.42678699467211[/C][/ROW]
[ROW][C]33[/C][C]5.62339142119244[/C][/ROW]
[ROW][C]34[/C][C]5.96437605691548[/C][/ROW]
[ROW][C]35[/C][C]6.49628545269212[/C][/ROW]
[ROW][C]36[/C][C]6.58103450771045[/C][/ROW]
[ROW][C]37[/C][C]6.70171900091033[/C][/ROW]
[ROW][C]38[/C][C]6.73058613694655[/C][/ROW]
[ROW][C]39[/C][C]6.81909084849301[/C][/ROW]
[ROW][C]40[/C][C]7.20347211236167[/C][/ROW]
[ROW][C]41[/C][C]7.7150883321705[/C][/ROW]
[ROW][C]42[/C][C]7.74725803374203[/C][/ROW]
[ROW][C]43[/C][C]7.8447434629821[/C][/ROW]
[ROW][C]44[/C][C]8.0466120504973[/C][/ROW]
[ROW][C]45[/C][C]8.3441425108843[/C][/ROW]
[ROW][C]46[/C][C]8.45103544032073[/C][/ROW]
[ROW][C]47[/C][C]8.45990543682378[/C][/ROW]
[ROW][C]48[/C][C]8.56939387663422[/C][/ROW]
[ROW][C]49[/C][C]8.91282492113824[/C][/ROW]
[ROW][C]50[/C][C]9.1933168150248[/C][/ROW]
[ROW][C]51[/C][C]9.26949089206632[/C][/ROW]
[ROW][C]52[/C][C]9.3454961405434[/C][/ROW]
[ROW][C]53[/C][C]9.50012946557253[/C][/ROW]
[ROW][C]54[/C][C]9.54430973502844[/C][/ROW]
[ROW][C]55[/C][C]10.3498792263487[/C][/ROW]
[ROW][C]56[/C][C]11.3471868144622[/C][/ROW]
[ROW][C]57[/C][C]11.5547179514600[/C][/ROW]
[ROW][C]58[/C][C]12.5635840995395[/C][/ROW]
[ROW][C]59[/C][C]12.6110661251402[/C][/ROW]
[ROW][C]60[/C][C]13.3754496768022[/C][/ROW]
[ROW][C]61[/C][C]13.9241416568346[/C][/ROW]
[ROW][C]62[/C][C]18.0991828471803[/C][/ROW]
[ROW][C]63[/C][C]18.4946525129736[/C][/ROW]
[ROW][C]64[/C][C]20.2376117206061[/C][/ROW]
[ROW][C]65[/C][C]20.2986371456707[/C][/ROW]
[ROW][C]66[/C][C]22.675989995303[/C][/ROW]
[ROW][C]67[/C][C]25.0714082712866[/C][/ROW]
[ROW][C]68[/C][C]25.2296929088941[/C][/ROW]
[ROW][C]69[/C][C]25.7177979187179[/C][/ROW]
[ROW][C]70[/C][C]26.2352251129129[/C][/ROW]
[ROW][C]71[/C][C]26.6461161159687[/C][/ROW]
[ROW][C]72[/C][C]29.3347350238217[/C][/ROW]
[ROW][C]73[/C][C]33.2167887544979[/C][/ROW]
[ROW][C]74[/C][C]36.5136666427946[/C][/ROW]
[ROW][C]75[/C][C]38.5075635155270[/C][/ROW]
[ROW][C]76[/C][C]39.8461725290528[/C][/ROW]
[ROW][C]77[/C][C]46.8151583875458[/C][/ROW]
[ROW][C]78[/C][C]49.0341339285924[/C][/ROW]
[ROW][C]79[/C][C]61.0424208159177[/C][/ROW]
[ROW][C]80[/C][C]80.6472601342296[/C][/ROW]
[ROW][C]81[/C][C]121.547205342734[/C][/ROW]
[ROW][C]82[/C][C]152.920783915421[/C][/ROW]
[ROW][C]83[/C][C]255.062315074147[/C][/ROW]
[ROW][C]84[/C][C]680.616476883125[/C][/ROW]
[/TABLE]
Source: https://freestatistics.org/blog/index.php?pk=24139&T=1

Globally Unique Identifier (entire table): ba.freestatistics.org/blog/index.php?pk=24139&T=1

As an alternative you can also use a QR Code:  

The GUIDs for individual cells are displayed in the table below:

Summary of Dendrogram
LabelHeight
11.79168992949735
21.94422229282815
32.40416779297055
42.43515913515519
52.535758613688
62.6925824060872
72.73130283500468
82.96984848098390
93.00998364666029
103.18333374323805
113.40293991068268
123.4842503775909
133.59029011408157
143.61109402777765
153.64143007854879
163.92960181467499
174.17255334960276
184.47660633321512
194.60108683643955
204.63896540190065
214.68028947805942
224.75184199499103
235.08428952806283
245.17783738971267
255.1893363725513
265.26214627972185
275.26741047141656
285.28677610146172
295.32183410642805
305.3218731788598
315.32916625821537
325.42678699467211
335.62339142119244
345.96437605691548
356.49628545269212
366.58103450771045
376.70171900091033
386.73058613694655
396.81909084849301
407.20347211236167
417.7150883321705
427.74725803374203
437.8447434629821
448.0466120504973
458.3441425108843
468.45103544032073
478.45990543682378
488.56939387663422
498.91282492113824
509.1933168150248
519.26949089206632
529.3454961405434
539.50012946557253
549.54430973502844
5510.3498792263487
5611.3471868144622
5711.5547179514600
5812.5635840995395
5912.6110661251402
6013.3754496768022
6113.9241416568346
6218.0991828471803
6318.4946525129736
6420.2376117206061
6520.2986371456707
6622.675989995303
6725.0714082712866
6825.2296929088941
6925.7177979187179
7026.2352251129129
7126.6461161159687
7229.3347350238217
7333.2167887544979
7436.5136666427946
7538.5075635155270
7639.8461725290528
7746.8151583875458
7849.0341339285924
7961.0424208159177
8080.6472601342296
81121.547205342734
82152.920783915421
83255.062315074147
84680.616476883125


Parameters (Session):
par1 = ward ; par2 = ALL ; par3 = TRUE ; par4 = FALSE ;
Parameters (R input):
par1 = ward ; par2 = ALL ; par3 = TRUE ; par4 = FALSE ;
R code (references can be found in the software module):
par3 <- as.logical(par3)
par4 <- as.logical(par4)
if (par3 == 'TRUE'){
dum = xlab
xlab = ylab
ylab = dum
}
x <- t(y)
hc <- hclust(dist(x),method=par1)
d <- as.dendrogram(hc)
str(d)
mysub <- paste('Method: ',par1)
bitmap(file='test1.png')
if (par4 == 'TRUE'){
plot(d,main=main,ylab=ylab,xlab=xlab,horiz=par3, nodePar=list(pch = c(1,NA), cex=0.8, lab.cex = 0.8),type='t',center=T, sub=mysub)
} else {
plot(d,main=main,ylab=ylab,xlab=xlab,horiz=par3, nodePar=list(pch = c(1,NA), cex=0.8, lab.cex = 0.8), sub=mysub)
}
dev.off()
if (par2 != 'ALL'){
if (par3 == 'TRUE'){
ylab = 'cluster'
} else {
xlab = 'cluster'
}
par2 <- as.numeric(par2)
memb <- cutree(hc, k = par2)
cent <- NULL
for(k in 1:par2){
cent <- rbind(cent, colMeans(x[memb == k, , drop = FALSE]))
}
hc1 <- hclust(dist(cent),method=par1, members = table(memb))
de <- as.dendrogram(hc1)
bitmap(file='test2.png')
if (par4 == 'TRUE'){
plot(de,main=main,ylab=ylab,xlab=xlab,horiz=par3, nodePar=list(pch = c(1,NA), cex=0.8, lab.cex = 0.8),type='t',center=T, sub=mysub)
} else {
plot(de,main=main,ylab=ylab,xlab=xlab,horiz=par3, nodePar=list(pch = c(1,NA), cex=0.8, lab.cex = 0.8), sub=mysub)
}
dev.off()
str(de)
}
load(file='createtable')
a<-table.start()
a<-table.row.start(a)
a<-table.element(a,'Summary of Dendrogram',2,TRUE)
a<-table.row.end(a)
a<-table.row.start(a)
a<-table.element(a,'Label',header=TRUE)
a<-table.element(a,'Height',header=TRUE)
a<-table.row.end(a)
num <- length(x[,1])-1
for (i in 1:num)
{
a<-table.row.start(a)
a<-table.element(a,hc$labels[i])
a<-table.element(a,hc$height[i])
a<-table.row.end(a)
}
a<-table.end(a)
table.save(a,file='mytable1.tab')
if (par2 != 'ALL'){
a<-table.start()
a<-table.row.start(a)
a<-table.element(a,'Summary of Cut Dendrogram',2,TRUE)
a<-table.row.end(a)
a<-table.row.start(a)
a<-table.element(a,'Label',header=TRUE)
a<-table.element(a,'Height',header=TRUE)
a<-table.row.end(a)
num <- par2-1
for (i in 1:num)
{
a<-table.row.start(a)
a<-table.element(a,i)
a<-table.element(a,hc1$height[i])
a<-table.row.end(a)
}
a<-table.end(a)
table.save(a,file='mytable2.tab')
}