Free Statistics

of Irreproducible Research!

Author's title

Author*Unverified author*
R Software Modulerwasp_cloud.wasp
Title produced by softwareTrivariate Scatterplots
Date of computationWed, 12 Nov 2008 04:07:24 -0700
Cite this page as followsStatistical Computations at FreeStatistics.org, Office for Research Development and Education, URL https://freestatistics.org/blog/index.php?v=date/2008/Nov/12/t1226488160xzrj32soptqhxyg.htm/, Retrieved Sun, 19 May 2024 12:34:32 +0000
Statistical Computations at FreeStatistics.org, Office for Research Development and Education, URL https://freestatistics.org/blog/index.php?pk=24127, Retrieved Sun, 19 May 2024 12:34:32 +0000
QR Codes:

Original text written by user:
IsPrivate?No (this computation is public)
User-defined keywords
Estimated Impact146
Family? (F = Feedback message, R = changed R code, M = changed R Module, P = changed Parameters, D = changed Data)
F       [Trivariate Scatterplots] [Workshop 3 Q1 (c)] [2008-11-12 11:07:24] [1a15026c70cce1c14dcfcc267c5d8133] [Current]
Feedback Forum
2008-11-15 13:15:44 [Ken Wright] [reply
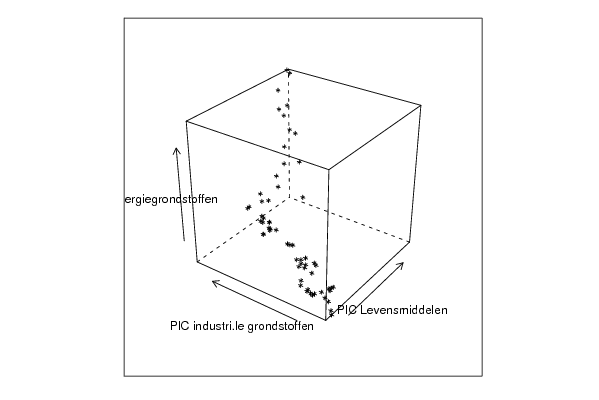
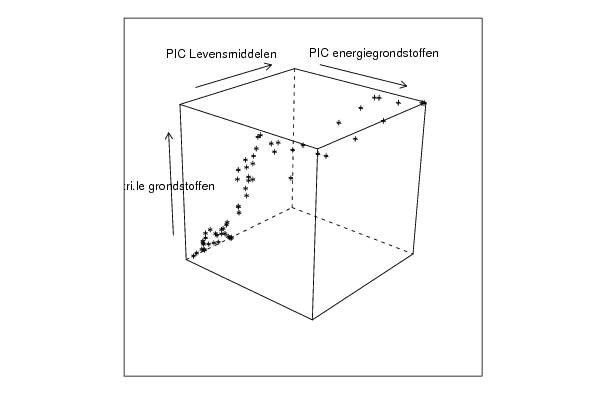
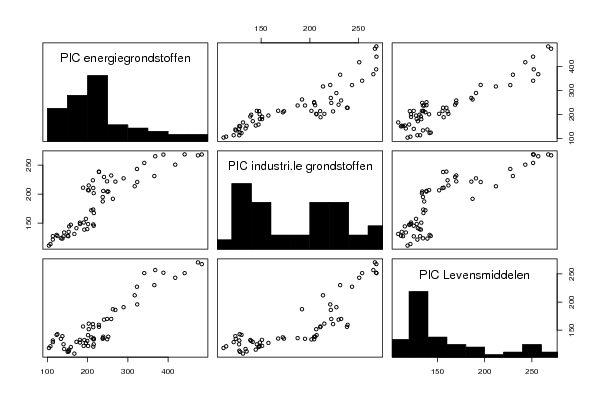
In deze matrix wordt de correlatie tussen de verschillende variabelen gegeven die allemaal een positief correlatief verband hebben. De trivariate scatterplot wordt ook weergeven in een kubus die je niet in je werk hebt opgenomen. Het voordeel is hier dat je de correlatie tussen de 3 variabelen tergelijk kan zien. Maar het gebruik van een kubus heeft ook zijn nadelen: door een 3 dimensionele kubus 2 dimensioneel voor te stellen gaan er namelijk gegevens verloren. Dit programma probeert dit op te lossen door de kubussen langs verschillende kanten te projecteren.
2008-11-17 08:20:24 [006ad2c49b6a7c2ad6ab685cfc1dae56] [reply
Een trivariate scatterplot wordt gebruikt om de gegevens vanuit een derde dimensie te kunnen bekijken. Toch is dit niet optimaal want er is altijd een dimensie die wordt 'platgedrukt'. Je had ook de kubussen moeten opnemen in je werk.
2008-11-20 08:26:19 [Angelique Van de Vijver] [reply
Goede conclusie omtrent het positief correlatief verband tussen PIC levensmiddelen en PIC energiegrondstoffen. Je kan dus inderdaad de correlatie nagaan tussen 3 variabelen tegelijkertijd.
Verder zou ik nog extra informatie vermelden: De trivariate scatterplot laat de correlatie zien tussen de verschillende variabelen die allemaal een positief correlatief verband hebben aangezien de puntenwolk volgens de diagonaal naar rechtsboven lopen. De trivariate scatterplot wordt ook weergeven in verschillende kubussen (zie link) Het voordeel is hier dat je de correlatie tussen de 3 variabelen tegelijk kan zien. Er zijn 3 kubussen weergegeven waarbij telkens vanuit een ander perspectief wordt gekeken. De trivariate scatterplots zijn projecties van die kubus. De trivariate scatterplots kunnen dus een vertekend beeld geven doordat er telkens 1 dimensie wordt weggelaten. (kubus=driedimensionaal)(trivariate scatterplot=tweedimensionaal) Daarom worden de kubussen vanuit verschillende perspectieven bekeken zodat je met alle dimensies rekening kunt houden en je alle fenomenen kunt vaststellen.

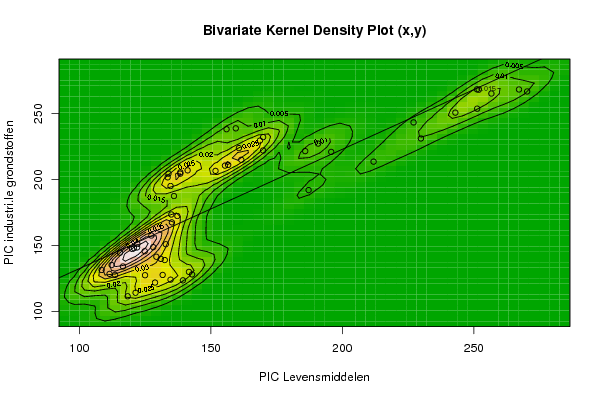
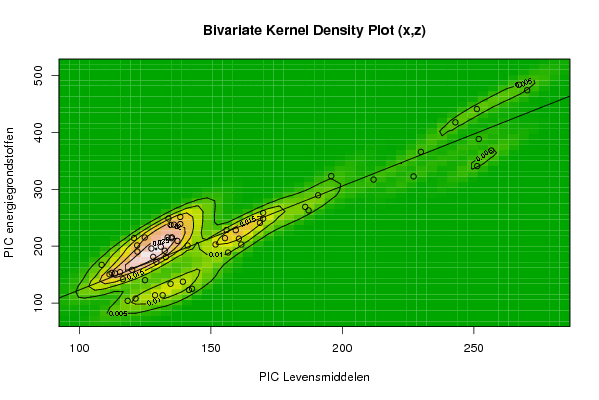
Vanonder heb je nog eens de bivariate kernel density (die al eerder besproken zijn) waar je dus ook de positieve correlatie kunt vaststellen aangezien de clusters ellipsvormig zijn en naar rechtsboven gericht zijn. De clusters liggen allemaal rond de diagonaal.
2008-11-24 12:09:08 [Anouk Greeve] [reply
Goede interpretatie.

Post a new message
Dataseries X:
118,4
121,4
128,8
131,7
141,7
142,9
139,4
134,7
125,0
113,6
111,5
108,5
112,3
116,6
115,5
120,1
132,9
128,1
129,3
132,5
131,0
124,9
120,8
122,0
122,1
127,4
135,2
137,3
135,0
136,0
138,4
134,7
138,4
133,9
133,6
141,2
151,8
155,4
156,6
161,6
160,7
156,0
159,5
168,7
169,9
169,9
185,9
190,8
195,8
211,9
227,1
251,3
256,7
251,9
251,2
270,3
267,2
243,0
229,9
187,2
Dataseries Y:
111,4
114,1
121,8
127,6
129,9
128,0
123,5
124,0
127,4
127,6
128,4
131,4
135,1
134,0
144,5
147,3
150,9
148,7
141,4
138,9
139,8
145,6
147,9
148,5
151,1
157,5
167,5
172,3
173,5
187,5
205,5
195,1
204,5
204,5
201,7
207,0
206,6
210,6
211,1
215,0
223,9
238,2
238,9
229,6
232,2
222,1
221,6
227,3
221,0
213,6
243,4
253,8
265,3
268,2
268,5
266,9
268,4
250,8
231,2
192,0
Dataseries Z:
104,0
107,9
113,8
113,8
123,1
125,1
137,6
134,0
140,3
152,1
150,6
167,3
153,2
142,0
154,4
158,5
180,9
181,3
172,4
192,0
199,3
215,4
214,3
201,5
190,5
196,0
215,7
209,4
214,1
237,8
239,0
237,8
251,5
248,8
215,4
201,2
203,1
214,2
188,9
203,0
213,3
228,5
228,2
240,9
258,8
248,5
269,2
289,6
323,4
317,2
322,8
340,9
368,2
388,5
441,2
474,3
483,9
417,9
365,9
263,0


Summary of computational transaction
Raw Inputview raw input (R code)
Raw Outputview raw output of R engine
Computing time3 seconds
R Server'Gwilym Jenkins' @ 72.249.127.135

\begin{tabular}{lllllllll}
\hline
Summary of computational transaction \tabularnewline
Raw Input & view raw input (R code)  \tabularnewline
Raw Output & view raw output of R engine  \tabularnewline
Computing time & 3 seconds \tabularnewline
R Server & 'Gwilym Jenkins' @ 72.249.127.135 \tabularnewline
\hline
\end{tabular}
%Source: https://freestatistics.org/blog/index.php?pk=24127&T=0

[TABLE]
[ROW][C]Summary of computational transaction[/C][/ROW]
[ROW][C]Raw Input[/C][C]view raw input (R code) [/C][/ROW]
[ROW][C]Raw Output[/C][C]view raw output of R engine [/C][/ROW]
[ROW][C]Computing time[/C][C]3 seconds[/C][/ROW]
[ROW][C]R Server[/C][C]'Gwilym Jenkins' @ 72.249.127.135[/C][/ROW]
[/TABLE]
Source: https://freestatistics.org/blog/index.php?pk=24127&T=0

Globally Unique Identifier (entire table): ba.freestatistics.org/blog/index.php?pk=24127&T=0

As an alternative you can also use a QR Code:  

The GUIDs for individual cells are displayed in the table below:

Summary of computational transaction
Raw Inputview raw input (R code)
Raw Outputview raw output of R engine
Computing time3 seconds
R Server'Gwilym Jenkins' @ 72.249.127.135


Parameters (Session):
par1 = 50 ; par2 = 50 ; par3 = Y ; par4 = Y ; par5 = PIC Levensmiddelen ; par6 = PIC industriële grondstoffen ; par7 = PIC energiegrondstoffen ;
Parameters (R input):
par1 = 50 ; par2 = 50 ; par3 = Y ; par4 = Y ; par5 = PIC Levensmiddelen ; par6 = PIC industriële grondstoffen ; par7 = PIC energiegrondstoffen ;
R code (references can be found in the software module):
x <- array(x,dim=c(length(x),1))
colnames(x) <- par5
y <- array(y,dim=c(length(y),1))
colnames(y) <- par6
z <- array(z,dim=c(length(z),1))
colnames(z) <- par7
d <- data.frame(cbind(z,y,x))
colnames(d) <- list(par7,par6,par5)
par1 <- as.numeric(par1)
par2 <- as.numeric(par2)
if (par1>500) par1 <- 500
if (par2>500) par2 <- 500
if (par1<10) par1 <- 10
if (par2<10) par2 <- 10
library(GenKern)
library(lattice)
panel.hist <- function(x, ...)
{
usr <- par('usr'); on.exit(par(usr))
par(usr = c(usr[1:2], 0, 1.5) )
h <- hist(x, plot = FALSE)
breaks <- h$breaks; nB <- length(breaks)
y <- h$counts; y <- y/max(y)
rect(breaks[-nB], 0, breaks[-1], y, col='black', ...)
}
bitmap(file='cloud1.png')
cloud(z~x*y, screen = list(x=-45, y=45, z=35),xlab=par5,ylab=par6,zlab=par7)
dev.off()
bitmap(file='cloud2.png')
cloud(z~x*y, screen = list(x=35, y=45, z=25),xlab=par5,ylab=par6,zlab=par7)
dev.off()
bitmap(file='cloud3.png')
cloud(z~x*y, screen = list(x=35, y=-25, z=90),xlab=par5,ylab=par6,zlab=par7)
dev.off()
bitmap(file='pairs.png')
pairs(d,diag.panel=panel.hist)
dev.off()
x <- as.vector(x)
y <- as.vector(y)
z <- as.vector(z)
bitmap(file='bidensity1.png')
op <- KernSur(x,y, xgridsize=par1, ygridsize=par2, correlation=cor(x,y), xbandwidth=dpik(x), ybandwidth=dpik(y))
image(op$xords, op$yords, op$zden, col=terrain.colors(100), axes=TRUE,main='Bivariate Kernel Density Plot (x,y)',xlab=par5,ylab=par6)
if (par3=='Y') contour(op$xords, op$yords, op$zden, add=TRUE)
if (par4=='Y') points(x,y)
(r<-lm(y ~ x))
abline(r)
box()
dev.off()
bitmap(file='bidensity2.png')
op <- KernSur(y,z, xgridsize=par1, ygridsize=par2, correlation=cor(y,z), xbandwidth=dpik(y), ybandwidth=dpik(z))
op
image(op$xords, op$yords, op$zden, col=terrain.colors(100), axes=TRUE,main='Bivariate Kernel Density Plot (y,z)',xlab=par6,ylab=par7)
if (par3=='Y') contour(op$xords, op$yords, op$zden, add=TRUE)
if (par4=='Y') points(y,z)
(r<-lm(z ~ y))
abline(r)
box()
dev.off()
bitmap(file='bidensity3.png')
op <- KernSur(x,z, xgridsize=par1, ygridsize=par2, correlation=cor(x,z), xbandwidth=dpik(x), ybandwidth=dpik(z))
op
image(op$xords, op$yords, op$zden, col=terrain.colors(100), axes=TRUE,main='Bivariate Kernel Density Plot (x,z)',xlab=par5,ylab=par7)
if (par3=='Y') contour(op$xords, op$yords, op$zden, add=TRUE)
if (par4=='Y') points(x,z)
(r<-lm(z ~ x))
abline(r)
box()
dev.off()