Free Statistics

of Irreproducible Research!

Author's title

Author*The author of this computation has been verified*
R Software Modulerwasp_boxcoxlin.wasp
Title produced by softwareBox-Cox Linearity Plot
Date of computationWed, 12 Nov 2008 03:57:40 -0700
Cite this page as followsStatistical Computations at FreeStatistics.org, Office for Research Development and Education, URL https://freestatistics.org/blog/index.php?v=date/2008/Nov/12/t1226487669f7n0n48vt1z79ij.htm/, Retrieved Sun, 19 May 2024 10:42:59 +0000
Statistical Computations at FreeStatistics.org, Office for Research Development and Education, URL https://freestatistics.org/blog/index.php?pk=24117, Retrieved Sun, 19 May 2024 10:42:59 +0000
QR Codes:

Original text written by user:
IsPrivate?No (this computation is public)
User-defined keywordsLaura_Reussens K_Vanderheggen hundrasmet
Estimated Impact173
Family? (F = Feedback message, R = changed R code, M = changed R Module, P = changed Parameters, D = changed Data)
F       [Box-Cox Linearity Plot] [Box Cox linearity...] [2008-11-12 10:57:40] [c9806d8558b4490616784faa930c3842] [Current]
-    D    [Box-Cox Linearity Plot] [Paper Box-Cox] [2008-12-19 16:57:57] [1640119c345fbfa2091dc1243f79f7a6]
Feedback Forum
2008-11-15 11:27:02 [Käthe Vanderheggen] [reply
De definitie is niet volledig. bij het kopiëren werd het lambda teken niet herkend en dus overal weggelaten.

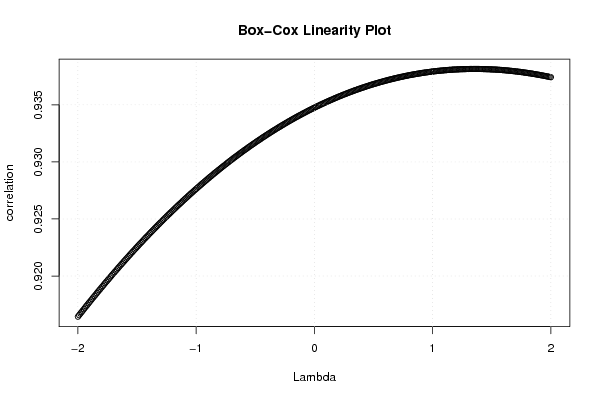
Er is een stijgend verloop, er is dus een stijgende correlatie en samenhang naar gelang een hogere transformatie. Lambda geeft de graad van transformatie weer lambda = 0 is het oorspronkelijke.
We zien dat de curve duidelijk een maximum bereikte wanneer lambda = 1,.. . We gingen de mogelijkheid na of een variabele kon getransponeerd worden om zo nog een sterker lineair verband aan te tonen.
2008-11-15 14:38:23 [Hundra Smet] [reply
zoals Käthe ook reeds zei gaan we door middel van de box cox transformation na of de data te transformeren zijn tot een lineair verband.

in de box cox linearity plot van de student zien we een positieve parabool waarvan het maximum zich bevindt rond (1,35;0,94). gevolg hiervan is dat 1,35 de beste transformatie is. (optimal lambda = 1,35 kan je zien in kadertje)

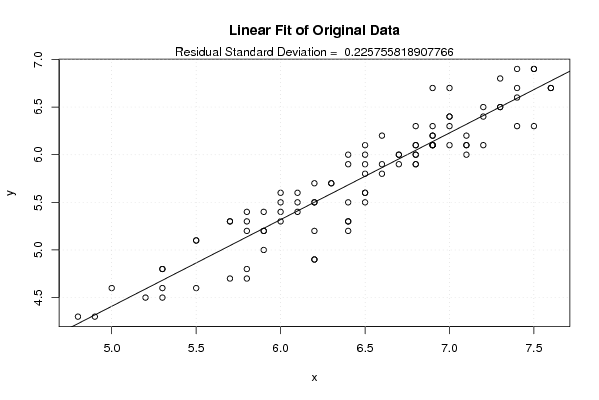
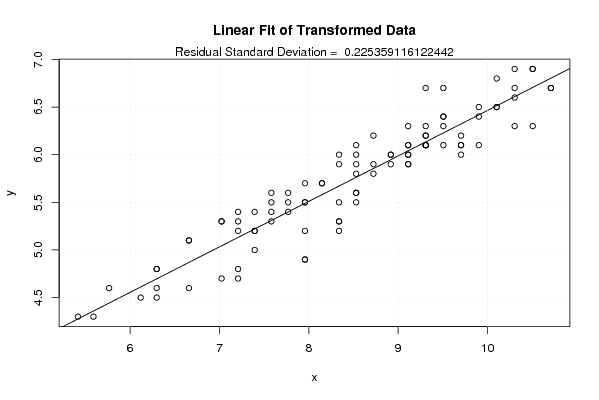
we zien dat bij de transformatie dat er niet echt een groot verschil is tussen de lineair fit van de originele data en die van de getransformeerde.
2008-11-18 10:45:06 [407693b66d7f2e0b350979005057872d] [reply
Q3

Bij de Box Cox linearity plot eeft een stijgende of dalende lijn met op de Y-as de correlatie n op de X- as Lambda tussen -2 en 2. Als er geen zinvolle transformatie is krijg je een rechte lijn / of .
2008-11-18 10:51:47 [407693b66d7f2e0b350979005057872d] [reply
Q3

Bij de Box Cox linearity plot eeft een stijgende of dalende lijn met op de Y-as de correlatie n op de X- as Lambda tussen -2 en 2. Als er geen zinvolle transformatie is krijg je een rechte lijn / of

2008-11-22 10:58:52 [Roel Geudens] [reply
De lambda waarde is hier de balgnrijkste parameter. Optimaal in dit geval is een lambda van 1.35 zoals in de output te zien is.
2008-11-24 10:06:59 [Yannick Van Schil] [reply
Er is een stijgende correlatie,lambda geeft de graad van transformatie weer. lambda = 0 is het oorspronkelijke.
Men ziet dat de curve duidelijk een maximum bereikt in lambda gelijk aan 1,35 .
2008-11-24 10:35:53 [Anouk Greeve] [reply
We gaan hier op zoek naar de beste transformatie van een niet zo lineaire rechte naar een lineaire rechte. De Box-Cox Linearity plot is een plot dat de correlatie tussen Y en de veranderlijke X weergeeft, voor gegeven waarden van de lambda. De waarde die het best beantwoordt aan de maximumcorrelatie (of minimum voor negatieve correlatie) in de plot is de optimale keuze voor de lambda.
2008-11-24 13:19:42 [Julian De Ruyter] [reply
Te beknopte conclusie bij de figuur gegeven door de student.
De box-cox lineairity plot probeert een variabele X te transformeren zodat het effect van correlatie hierdoor tussen 2variabelen hopelijk verhoogt wordt.
X-as = lamdba en Y-as is de correlatie tussen getransformeerde x en originele y. We gaan lambda tussen 2 en -2 laten verschuiven om een maximum in de functie te bekomen. Hier rond 1 gelegen.
De correlatie verhoogt hier echter niet dus de transformatie was zinloos.
2008-11-24 15:07:24 [Ellen Van den Broeck] [reply
In een box-cox linearityplot worden 2 variabelen in verband gebracht.
De X variabelen worden getransformeerd aan de hand van de Lamba die varieert tussen -2 en 2. Deze transformaties worden uitgevoerd om de scatterplot lineairder te maken. De lijn die je bekomt moet ergens een maximum bekomen. Bij de student is dit ongeveer het gevaltussen 1 en 2. Maar je hoopt om een bergparabool te bekomen, waar een duidelijk maximum is. Als je bij de student de lamba bv zou laten variëren tss -4 en 4 is er wel kans dat er een duidelijker maximum is.

Post a new message
Dataseries X:
5,8
5,8
5,7
5,5
5,3
5,2
5,3
5,3
5,0
4,8
4,9
5,3
6,0
6,2
6,4
6,4
6,4
6,2
6,1
6,0
5,9
6,2
6,2
6,4
6,8
6,9
7,0
7,0
6,9
6,7
6,6
6,5
6,4
6,5
6,5
6,6
6,7
6,8
7,2
7,6
7,6
7,3
6,4
6,1
6,3
7,1
7,5
7,4
7,1
6,8
6,9
7,2
7,4
7,3
6,9
6,9
6,8
7,1
7,2
7,1
7,0
6,9
7,0
7,4
7,5
7,5
7,4
7,3
7,0
6,7
6,5
6,5
6,5
6,6
6,8
6,9
6,9
6,8
6,8
6,5
6,1
6,0
5,9
5,8
5,9
5,9
6,2
6,3
6,2
6,0
5,8
5,5
5,5
5,7
5,8
5,7
Dataseries Y:
4,7
4,8
4,7
4,6
4,5
4,5
4,8
4,8
4,6
4,3
4,3
4,6
5,4
5,5
5,5
5,3
5,2
5,2
5,4
5,3
5,0
4,9
4,9
5,3
6,3
6,7
6,7
6,4
6,1
6,0
6,2
6,1
6,0
6,0
5,9
5,9
6,0
6,1
6,4
6,7
6,7
6,5
5,9
5,6
5,7
6,0
6,3
6,3
6,2
6,1
6,3
6,5
6,6
6,5
6,2
6,2
5,9
6,1
6,1
6,1
6,1
6,1
6,3
6,7
6,9
6,9
6,9
6,8
6,4
5,9
5,5
5,6
5,6
5,8
5,9
6,1
6,1
6,0
6,0
5,8
5,5
5,5
5,4
5,2
5,2
5,2
5,5
5,7
5,7
5,6
5,4
5,1
5,1
5,3
5,3
5,3


Summary of computational transaction
Raw Inputview raw input (R code)
Raw Outputview raw output of R engine
Computing time1 seconds
R Server'Gwilym Jenkins' @ 72.249.127.135

\begin{tabular}{lllllllll}
\hline
Summary of computational transaction \tabularnewline
Raw Input & view raw input (R code)  \tabularnewline
Raw Output & view raw output of R engine  \tabularnewline
Computing time & 1 seconds \tabularnewline
R Server & 'Gwilym Jenkins' @ 72.249.127.135 \tabularnewline
\hline
\end{tabular}
%Source: https://freestatistics.org/blog/index.php?pk=24117&T=0

[TABLE]
[ROW][C]Summary of computational transaction[/C][/ROW]
[ROW][C]Raw Input[/C][C]view raw input (R code) [/C][/ROW]
[ROW][C]Raw Output[/C][C]view raw output of R engine [/C][/ROW]
[ROW][C]Computing time[/C][C]1 seconds[/C][/ROW]
[ROW][C]R Server[/C][C]'Gwilym Jenkins' @ 72.249.127.135[/C][/ROW]
[/TABLE]
Source: https://freestatistics.org/blog/index.php?pk=24117&T=0

Globally Unique Identifier (entire table): ba.freestatistics.org/blog/index.php?pk=24117&T=0

As an alternative you can also use a QR Code:  

The GUIDs for individual cells are displayed in the table below:

Summary of computational transaction
Raw Inputview raw input (R code)
Raw Outputview raw output of R engine
Computing time1 seconds
R Server'Gwilym Jenkins' @ 72.249.127.135


Box-Cox Linearity Plot
# observations x96
maximum correlation0.938144873702289
optimal lambda(x)1.35
Residual SD (orginial)0.225755818907766
Residual SD (transformed)0.225359116122442

\begin{tabular}{lllllllll}
\hline
Box-Cox Linearity Plot \tabularnewline
# observations x & 96 \tabularnewline
maximum correlation & 0.938144873702289 \tabularnewline
optimal lambda(x) & 1.35 \tabularnewline
Residual SD (orginial) & 0.225755818907766 \tabularnewline
Residual SD (transformed) & 0.225359116122442 \tabularnewline
\hline
\end{tabular}
%Source: https://freestatistics.org/blog/index.php?pk=24117&T=1

[TABLE]
[ROW][C]Box-Cox Linearity Plot[/C][/ROW]
[ROW][C]# observations x[/C][C]96[/C][/ROW]
[ROW][C]maximum correlation[/C][C]0.938144873702289[/C][/ROW]
[ROW][C]optimal lambda(x)[/C][C]1.35[/C][/ROW]
[ROW][C]Residual SD (orginial)[/C][C]0.225755818907766[/C][/ROW]
[ROW][C]Residual SD (transformed)[/C][C]0.225359116122442[/C][/ROW]
[/TABLE]
Source: https://freestatistics.org/blog/index.php?pk=24117&T=1

Globally Unique Identifier (entire table): ba.freestatistics.org/blog/index.php?pk=24117&T=1

As an alternative you can also use a QR Code:  

The GUIDs for individual cells are displayed in the table below:

Box-Cox Linearity Plot
# observations x96
maximum correlation0.938144873702289
optimal lambda(x)1.35
Residual SD (orginial)0.225755818907766
Residual SD (transformed)0.225359116122442


Parameters (Session):
Parameters (R input):
R code (references can be found in the software module):
n <- length(x)
c <- array(NA,dim=c(401))
l <- array(NA,dim=c(401))
mx <- 0
mxli <- -999
for (i in 1:401)
{
l[i] <- (i-201)/100
if (l[i] != 0)
{
x1 <- (x^l[i] - 1) / l[i]
} else {
x1 <- log(x)
}
c[i] <- cor(x1,y)
if (mx < abs(c[i]))
{
mx <- abs(c[i])
mxli <- l[i]
}
}
c
mx
mxli
if (mxli != 0)
{
x1 <- (x^mxli - 1) / mxli
} else {
x1 <- log(x)
}
r<-lm(y~x)
se <- sqrt(var(r$residuals))
r1 <- lm(y~x1)
se1 <- sqrt(var(r1$residuals))
bitmap(file='test1.png')
plot(l,c,main='Box-Cox Linearity Plot',xlab='Lambda',ylab='correlation')
grid()
dev.off()
bitmap(file='test2.png')
plot(x,y,main='Linear Fit of Original Data',xlab='x',ylab='y')
abline(r)
grid()
mtext(paste('Residual Standard Deviation = ',se))
dev.off()
bitmap(file='test3.png')
plot(x1,y,main='Linear Fit of Transformed Data',xlab='x',ylab='y')
abline(r1)
grid()
mtext(paste('Residual Standard Deviation = ',se1))
dev.off()
load(file='createtable')
a<-table.start()
a<-table.row.start(a)
a<-table.element(a,'Box-Cox Linearity Plot',2,TRUE)
a<-table.row.end(a)
a<-table.row.start(a)
a<-table.element(a,'# observations x',header=TRUE)
a<-table.element(a,n)
a<-table.row.end(a)
a<-table.row.start(a)
a<-table.element(a,'maximum correlation',header=TRUE)
a<-table.element(a,mx)
a<-table.row.end(a)
a<-table.row.start(a)
a<-table.element(a,'optimal lambda(x)',header=TRUE)
a<-table.element(a,mxli)
a<-table.row.end(a)
a<-table.row.start(a)
a<-table.element(a,'Residual SD (orginial)',header=TRUE)
a<-table.element(a,se)
a<-table.row.end(a)
a<-table.row.start(a)
a<-table.element(a,'Residual SD (transformed)',header=TRUE)
a<-table.element(a,se1)
a<-table.row.end(a)
a<-table.end(a)
table.save(a,file='mytable.tab')