Free Statistics

of Irreproducible Research!

Author's title

Author*The author of this computation has been verified*
R Software Modulerwasp_bidensity.wasp
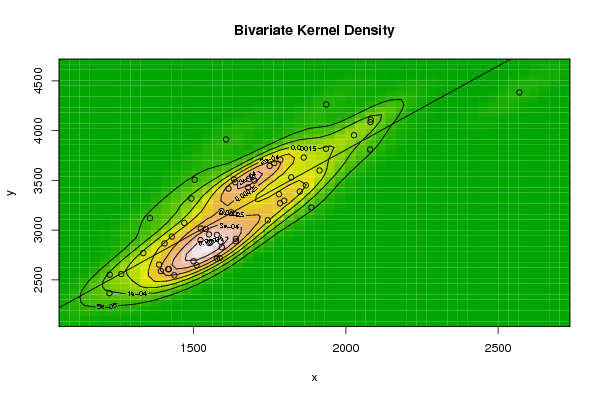
Title produced by softwareBivariate Kernel Density Estimation
Date of computationWed, 12 Nov 2008 03:41:11 -0700
Cite this page as followsStatistical Computations at FreeStatistics.org, Office for Research Development and Education, URL https://freestatistics.org/blog/index.php?v=date/2008/Nov/12/t12264865046b6c04vgvzsg93g.htm/, Retrieved Mon, 27 May 2024 21:59:27 +0000
Statistical Computations at FreeStatistics.org, Office for Research Development and Education, URL https://freestatistics.org/blog/index.php?pk=24072, Retrieved Mon, 27 May 2024 21:59:27 +0000
QR Codes:

Original text written by user:
IsPrivate?No (this computation is public)
User-defined keywords
Estimated Impact181
Family? (F = Feedback message, R = changed R code, M = changed R Module, P = changed Parameters, D = changed Data)
F       [Bivariate Kernel Density Estimation] [q2] [2008-11-12 10:41:11] [7596afe9a05f2a2719ece78b1b0e12e6] [Current]
Feedback Forum
2008-11-15 16:20:50 [Laura Reussens] [reply
Bij een bivariate Kernel density plot wordt de 3e dimensie gesuggereerd op basis van hoogtelijnen. Deze hoogtelijnen geven de concentratie van de de punten in het scatterplot weer. Wanneer er een hoge concentratie is van hoogtelijnen, dus wanneer deze dicht bij elkaar liggen, kan men besluiten dat de waarschijnlijkheid dat deze punten zich hier bevinden zeer groot is.
In het density plot uit de opdracht zien we 2 ellipsen met geconcentreerde hoogtelijnen. Uit de ellipsvorm kunnen we besluiten dat er een positieve correlatie is tussen het aantal gebouwen en het aantal woningen.
2008-11-22 13:23:04 [Sandra Hofmans] [reply
Dit klopt. Je ziet duidelijk dat er een hoge concentratie is van punten vlakbij de regressielijn. Er zijn duidelijke ellipsen waar te nemen (hier duiden ze op een positief verband). Wanneer we echter cirkels waar nemen betekent dat er geen verband is. (Hier niet zo!)
2008-11-24 18:55:56 [Sören Van Donink] [reply
Ik kan je grafieken in je werk niet zien. Dit heeft wss te maken doordat ik geen windows gebruik maar mac. Aan de hand van wat ik lees van anderen vermoed ik wel dat je een correcte berekening hebt gemaakt.

Post a new message
Dataseries X:
1784
1429
1744
1551
1679
1639
1393
1405
1750
1263
1357
1593
1821
1419
1524
1637
1540
1623
1523
1335
1700
1615
1493
1577
1607
1765
1504
1936
1862
2570
2082
1781
1869
1785
1682
1556
2080
2027
1887
1935
1798
1589
1592
1387
1849
1470
1437
1500
2081
1552
1586
1914
1639
1633
1693
1224
1417
1577
1225
1510
Dataseries Y:
3269
2934
3098
2956
3429
2887
2587
2865
3645
2557
3120
2827
3530
2606
3015
3481
3011
3179
2899
2768
3498
3417
3317
2951
3911
3674
3505
4263
3729
4384
4110
3360
3450
3708
3515
2877
3810
3953
3226
3818
3295
2884
3190
2652
3388
3071
2545
2686
4085
2869
2719
3599
2912
3509
3533
2365
2606
2712
2551
2646


Summary of computational transaction
Raw Inputview raw input (R code)
Raw Outputview raw output of R engine
Computing time3 seconds
R Server'Sir Ronald Aylmer Fisher' @ 193.190.124.24

\begin{tabular}{lllllllll}
\hline
Summary of computational transaction \tabularnewline
Raw Input & view raw input (R code)  \tabularnewline
Raw Output & view raw output of R engine  \tabularnewline
Computing time & 3 seconds \tabularnewline
R Server & 'Sir Ronald Aylmer Fisher' @ 193.190.124.24 \tabularnewline
\hline
\end{tabular}
%Source: https://freestatistics.org/blog/index.php?pk=24072&T=0

[TABLE]
[ROW][C]Summary of computational transaction[/C][/ROW]
[ROW][C]Raw Input[/C][C]view raw input (R code) [/C][/ROW]
[ROW][C]Raw Output[/C][C]view raw output of R engine [/C][/ROW]
[ROW][C]Computing time[/C][C]3 seconds[/C][/ROW]
[ROW][C]R Server[/C][C]'Sir Ronald Aylmer Fisher' @ 193.190.124.24[/C][/ROW]
[/TABLE]
Source: https://freestatistics.org/blog/index.php?pk=24072&T=0

Globally Unique Identifier (entire table): ba.freestatistics.org/blog/index.php?pk=24072&T=0

As an alternative you can also use a QR Code:  

The GUIDs for individual cells are displayed in the table below:

Summary of computational transaction
Raw Inputview raw input (R code)
Raw Outputview raw output of R engine
Computing time3 seconds
R Server'Sir Ronald Aylmer Fisher' @ 193.190.124.24


Bandwidth
x axis99.087896989572
y axis205.970247073056
Correlation
correlation used in KDE0.843269846653204
correlation(x,y)0.843269846653204

\begin{tabular}{lllllllll}
\hline
Bandwidth \tabularnewline
x axis & 99.087896989572 \tabularnewline
y axis & 205.970247073056 \tabularnewline
Correlation \tabularnewline
correlation used in KDE & 0.843269846653204 \tabularnewline
correlation(x,y) & 0.843269846653204 \tabularnewline
\hline
\end{tabular}
%Source: https://freestatistics.org/blog/index.php?pk=24072&T=1

[TABLE]
[ROW][C]Bandwidth[/C][/ROW]
[ROW][C]x axis[/C][C]99.087896989572[/C][/ROW]
[ROW][C]y axis[/C][C]205.970247073056[/C][/ROW]
[ROW][C]Correlation[/C][/ROW]
[ROW][C]correlation used in KDE[/C][C]0.843269846653204[/C][/ROW]
[ROW][C]correlation(x,y)[/C][C]0.843269846653204[/C][/ROW]
[/TABLE]
Source: https://freestatistics.org/blog/index.php?pk=24072&T=1

Globally Unique Identifier (entire table): ba.freestatistics.org/blog/index.php?pk=24072&T=1

As an alternative you can also use a QR Code:  

The GUIDs for individual cells are displayed in the table below:

Bandwidth
x axis99.087896989572
y axis205.970247073056
Correlation
correlation used in KDE0.843269846653204
correlation(x,y)0.843269846653204


Parameters (Session):
par1 = 50 ; par2 = 50 ; par3 = 0 ; par4 = 0 ; par5 = 0 ; par6 = Y ; par7 = Y ;
Parameters (R input):
par1 = 50 ; par2 = 50 ; par3 = 0 ; par4 = 0 ; par5 = 0 ; par6 = Y ; par7 = Y ;
R code (references can be found in the software module):
par1 <- as(par1,'numeric')
par2 <- as(par2,'numeric')
par3 <- as(par3,'numeric')
par4 <- as(par4,'numeric')
par5 <- as(par5,'numeric')
library('GenKern')
if (par3==0) par3 <- dpik(x)
if (par4==0) par4 <- dpik(y)
if (par5==0) par5 <- cor(x,y)
if (par1 > 500) par1 <- 500
if (par2 > 500) par2 <- 500
bitmap(file='bidensity.png')
op <- KernSur(x,y, xgridsize=par1, ygridsize=par2, correlation=par5, xbandwidth=par3, ybandwidth=par4)
image(op$xords, op$yords, op$zden, col=terrain.colors(100), axes=TRUE,main=main,xlab=xlab,ylab=ylab)
if (par6=='Y') contour(op$xords, op$yords, op$zden, add=TRUE)
if (par7=='Y') points(x,y)
(r<-lm(y ~ x))
abline(r)
box()
dev.off()
load(file='createtable')
a<-table.start()
a<-table.row.start(a)
a<-table.element(a,'Bandwidth',2,TRUE)
a<-table.row.end(a)
a<-table.row.start(a)
a<-table.element(a,'x axis',header=TRUE)
a<-table.element(a,par3)
a<-table.row.end(a)
a<-table.row.start(a)
a<-table.element(a,'y axis',header=TRUE)
a<-table.element(a,par4)
a<-table.row.end(a)
a<-table.row.start(a)
a<-table.element(a,'Correlation',2,TRUE)
a<-table.row.end(a)
a<-table.row.start(a)
a<-table.element(a,'correlation used in KDE',header=TRUE)
a<-table.element(a,par5)
a<-table.row.end(a)
a<-table.row.start(a)
a<-table.element(a,'correlation(x,y)',header=TRUE)
a<-table.element(a,cor(x,y))
a<-table.row.end(a)
a<-table.end(a)
table.save(a,file='mytable.tab')