Free Statistics

of Irreproducible Research!

Author's title

Author*The author of this computation has been verified*
R Software Modulerwasp_cloud.wasp
Title produced by softwareTrivariate Scatterplots
Date of computationWed, 12 Nov 2008 03:10:44 -0700
Cite this page as followsStatistical Computations at FreeStatistics.org, Office for Research Development and Education, URL https://freestatistics.org/blog/index.php?v=date/2008/Nov/12/t1226484694tlc4ggid2jub0ri.htm/, Retrieved Sun, 19 May 2024 12:18:38 +0000
Statistical Computations at FreeStatistics.org, Office for Research Development and Education, URL https://freestatistics.org/blog/index.php?pk=24042, Retrieved Sun, 19 May 2024 12:18:38 +0000
QR Codes:

Original text written by user:
IsPrivate?No (this computation is public)
User-defined keywords
Estimated Impact248
Family? (F = Feedback message, R = changed R code, M = changed R Module, P = changed Parameters, D = changed Data)
F       [Trivariate Scatterplots] [Various EDA topics 3] [2008-11-12 10:10:44] [ff1f39dba9ec26bf89aa666d9dcb6cc1] [Current]
Feedback Forum
2008-11-14 15:49:38 [Annemiek Hoofman] [reply
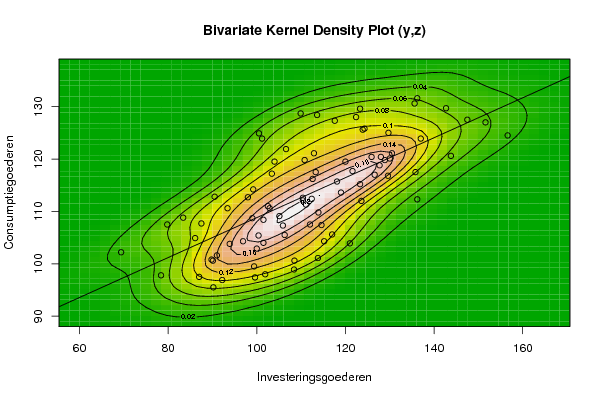
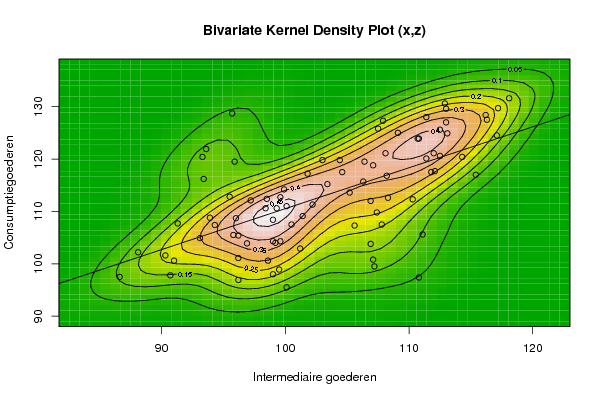
Een nadeel van deze methode is dat deze weergave ook en vertekend beeld geeft omdat er een dimensie wordt weggelaten.
2008-11-24 17:31:17 [5faab2fc6fb120339944528a32d48a04] [reply
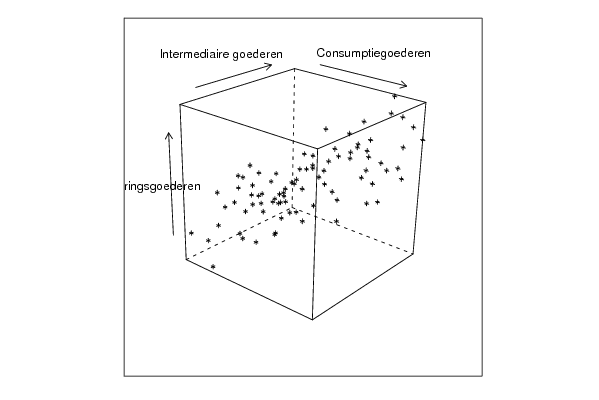
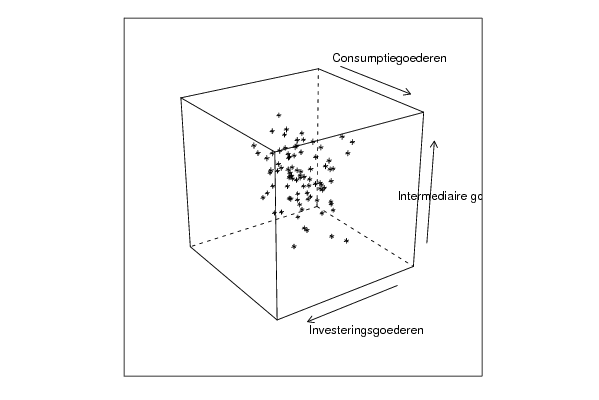
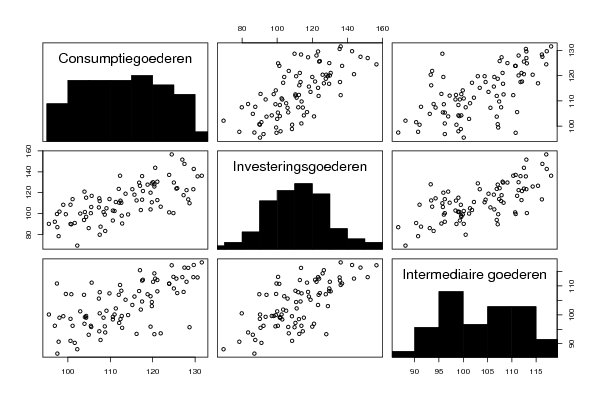
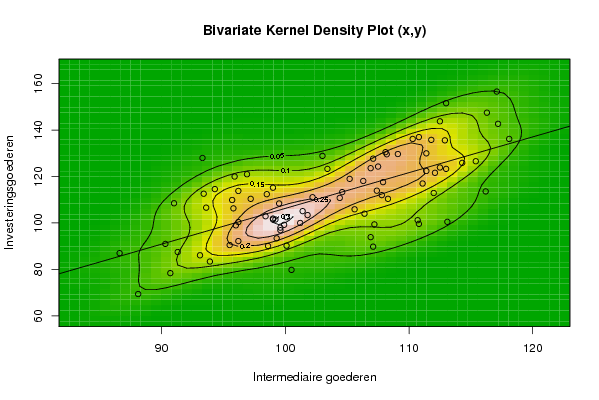
Door de driedimensionale kubussen in verschillende standpunten te bekijken kunnen we een zo duidelijk mogelijke conclusie vormen over het verband tussen de 3 variabelen. Als we deze herleiden naar een 2 dimensionale afbeelding wordt het effect van een derde variabele gereduceerd en kan dit dus een vertekent beeld geven. Hier is er een positief verband maar geen zeer sterk verband. De punten gaan namelijk in een rechte lijn van links onder naar rechts boven maar de punten liggen ver uitelkaar.
2008-11-24 20:32:36 [Kevin Vermeiren] [reply
Hier geeft de student een beperkt antwoord. Er worden geen conclusies uit de figuur getrokken. Zo is het duidelijk te zien dat er overal een positief lineair verband waarneembaar is. Verder worden er amper of geen voor- en/of nadelen van deze module besproken. Een duidelijk voordeel van deze module is het feit dat men op deze manier de drie variabelen in een handig overzicht met de onderlinge correlaties kan waarnemen (2 dimensionaal). Bij de kubusvoorstellingen (niet in het worddocument opgenomen) kunnen we de drie variabelen waarnemen in een 3 dimensionale plot. Uiteraard is dit zeer handig. Een nadeel aan deze kubusvoorstellingen vinden we in het feit dat er een vertekening optreedt bij het projecteren van de drie dimensionaliteit. Verder heeft de trivariate scatterplot het voordeel dat er vanuit verschillende invalshoeken gekeken kan worden naar de gegevens

Post a new message
Dataseries X:
90,7
94,3
104,6
111,1
110,8
107,2
99,0
99,0
91,0
96,2
96,9
96,2
100,1
99,0
115,4
106,9
107,1
99,3
99,2
108,3
105,6
99,5
107,4
93,1
88,1
110,7
113,1
99,6
93,6
98,6
99,6
114,3
107,8
101,2
112,5
100,5
93,9
116,2
112,0
106,4
95,7
96,0
95,8
103,0
102,2
98,4
111,4
86,6
91,3
107,9
101,8
104,4
93,4
100,1
98,5
112,9
101,4
107,1
110,8
90,3
95,5
111,4
113,0
107,5
95,9
106,3
105,2
117,2
106,9
108,2
113,0
97,2
99,9
108,1
118,1
109,1
93,3
112,1
111,8
112,5
116,3
110,3
117,1
103,4
96,2
Dataseries Y:
78,4
114,6
113,3
117,0
99,6
99,4
101,9
115,2
108,5
113,8
121,0
92,2
90,2
101,5
126,6
93,9
89,8
93,4
101,5
110,4
105,9
108,4
113,9
86,1
69,4
101,2
100,5
98,0
106,6
90,1
96,9
125,9
112,0
100,0
123,9
79,8
83,4
113,6
112,9
104,0
109,9
99,0
106,3
128,9
111,1
102,9
130,0
87,0
87,5
117,6
103,4
110,8
112,6
102,5
112,4
135,6
105,1
127,7
137,0
91,0
90,5
122,4
123,3
124,3
120,0
118,1
119,0
142,7
123,6
129,6
151,6
110,4
99,2
130,5
136,2
129,7
128,0
121,6
135,8
143,8
147,5
136,2
156,6
123,3
100,4
Dataseries Z:
97,8
107,4
117,5
105,6
97,4
99,5
98,0
104,3
100,6
101,1
103,9
96,9
95,5
108,4
117,0
103,8
100,8
110,6
104,0
112,6
107,3
98,9
109,8
104,9
102,2
123,9
124,9
112,7
121,9
100,6
104,3
120,4
107,5
102,9
125,6
107,5
108,8
128,4
121,1
119,5
128,7
108,7
105,5
119,8
111,3
110,6
120,1
97,5
107,7
127,3
117,2
119,8
116,2
111,0
112,4
130,6
109,1
118,8
123,9
101,6
112,8
128,0
129,6
125,8
119,5
115,7
113,6
129,7
112,0
116,8
127,0
112,1
114,2
121,1
131,6
125,0
120,4
117,7
117,5
120,6
127,5
112,3
124,5
115,2
105,4


Summary of computational transaction
Raw Inputview raw input (R code)
Raw Outputview raw output of R engine
Computing time5 seconds
R Server'Gwilym Jenkins' @ 72.249.127.135

\begin{tabular}{lllllllll}
\hline
Summary of computational transaction \tabularnewline
Raw Input & view raw input (R code)  \tabularnewline
Raw Output & view raw output of R engine  \tabularnewline
Computing time & 5 seconds \tabularnewline
R Server & 'Gwilym Jenkins' @ 72.249.127.135 \tabularnewline
\hline
\end{tabular}
%Source: https://freestatistics.org/blog/index.php?pk=24042&T=0

[TABLE]
[ROW][C]Summary of computational transaction[/C][/ROW]
[ROW][C]Raw Input[/C][C]view raw input (R code) [/C][/ROW]
[ROW][C]Raw Output[/C][C]view raw output of R engine [/C][/ROW]
[ROW][C]Computing time[/C][C]5 seconds[/C][/ROW]
[ROW][C]R Server[/C][C]'Gwilym Jenkins' @ 72.249.127.135[/C][/ROW]
[/TABLE]
Source: https://freestatistics.org/blog/index.php?pk=24042&T=0

Globally Unique Identifier (entire table): ba.freestatistics.org/blog/index.php?pk=24042&T=0

As an alternative you can also use a QR Code:  

The GUIDs for individual cells are displayed in the table below:

Summary of computational transaction
Raw Inputview raw input (R code)
Raw Outputview raw output of R engine
Computing time5 seconds
R Server'Gwilym Jenkins' @ 72.249.127.135


Parameters (Session):
par1 = 50 ; par2 = 50 ; par3 = Y ; par4 = Y ; par5 = Intermediaire goederen ; par6 = Investeringsgoederen ; par7 = Consumptiegoederen ;
Parameters (R input):
par1 = 50 ; par2 = 50 ; par3 = Y ; par4 = Y ; par5 = Intermediaire goederen ; par6 = Investeringsgoederen ; par7 = Consumptiegoederen ;
R code (references can be found in the software module):
x <- array(x,dim=c(length(x),1))
colnames(x) <- par5
y <- array(y,dim=c(length(y),1))
colnames(y) <- par6
z <- array(z,dim=c(length(z),1))
colnames(z) <- par7
d <- data.frame(cbind(z,y,x))
colnames(d) <- list(par7,par6,par5)
par1 <- as.numeric(par1)
par2 <- as.numeric(par2)
if (par1>500) par1 <- 500
if (par2>500) par2 <- 500
if (par1<10) par1 <- 10
if (par2<10) par2 <- 10
library(GenKern)
library(lattice)
panel.hist <- function(x, ...)
{
usr <- par('usr'); on.exit(par(usr))
par(usr = c(usr[1:2], 0, 1.5) )
h <- hist(x, plot = FALSE)
breaks <- h$breaks; nB <- length(breaks)
y <- h$counts; y <- y/max(y)
rect(breaks[-nB], 0, breaks[-1], y, col='black', ...)
}
bitmap(file='cloud1.png')
cloud(z~x*y, screen = list(x=-45, y=45, z=35),xlab=par5,ylab=par6,zlab=par7)
dev.off()
bitmap(file='cloud2.png')
cloud(z~x*y, screen = list(x=35, y=45, z=25),xlab=par5,ylab=par6,zlab=par7)
dev.off()
bitmap(file='cloud3.png')
cloud(z~x*y, screen = list(x=35, y=-25, z=90),xlab=par5,ylab=par6,zlab=par7)
dev.off()
bitmap(file='pairs.png')
pairs(d,diag.panel=panel.hist)
dev.off()
x <- as.vector(x)
y <- as.vector(y)
z <- as.vector(z)
bitmap(file='bidensity1.png')
op <- KernSur(x,y, xgridsize=par1, ygridsize=par2, correlation=cor(x,y), xbandwidth=dpik(x), ybandwidth=dpik(y))
image(op$xords, op$yords, op$zden, col=terrain.colors(100), axes=TRUE,main='Bivariate Kernel Density Plot (x,y)',xlab=par5,ylab=par6)
if (par3=='Y') contour(op$xords, op$yords, op$zden, add=TRUE)
if (par4=='Y') points(x,y)
(r<-lm(y ~ x))
abline(r)
box()
dev.off()
bitmap(file='bidensity2.png')
op <- KernSur(y,z, xgridsize=par1, ygridsize=par2, correlation=cor(y,z), xbandwidth=dpik(y), ybandwidth=dpik(z))
op
image(op$xords, op$yords, op$zden, col=terrain.colors(100), axes=TRUE,main='Bivariate Kernel Density Plot (y,z)',xlab=par6,ylab=par7)
if (par3=='Y') contour(op$xords, op$yords, op$zden, add=TRUE)
if (par4=='Y') points(y,z)
(r<-lm(z ~ y))
abline(r)
box()
dev.off()
bitmap(file='bidensity3.png')
op <- KernSur(x,z, xgridsize=par1, ygridsize=par2, correlation=cor(x,z), xbandwidth=dpik(x), ybandwidth=dpik(z))
op
image(op$xords, op$yords, op$zden, col=terrain.colors(100), axes=TRUE,main='Bivariate Kernel Density Plot (x,z)',xlab=par5,ylab=par7)
if (par3=='Y') contour(op$xords, op$yords, op$zden, add=TRUE)
if (par4=='Y') points(x,z)
(r<-lm(z ~ x))
abline(r)
box()
dev.off()