Free Statistics

of Irreproducible Research!

Author's title

Author*The author of this computation has been verified*
R Software Modulerwasp_hierarchicalclustering.wasp
Title produced by softwareHierarchical Clustering
Date of computationWed, 12 Nov 2008 02:15:49 -0700
Cite this page as followsStatistical Computations at FreeStatistics.org, Office for Research Development and Education, URL https://freestatistics.org/blog/index.php?v=date/2008/Nov/12/t1226481410rfpgn7hi8qo2dot.htm/, Retrieved Sun, 19 May 2024 11:12:41 +0000
Statistical Computations at FreeStatistics.org, Office for Research Development and Education, URL https://freestatistics.org/blog/index.php?pk=24024, Retrieved Sun, 19 May 2024 11:12:41 +0000
QR Codes:

Original text written by user:
IsPrivate?No (this computation is public)
User-defined keywordswerkloosheid julie govaerts
Estimated Impact219
Family? (F = Feedback message, R = changed R code, M = changed R Module, P = changed Parameters, D = changed Data)
-       [Hierarchical Clustering] [hierarchical clus...] [2008-11-12 09:15:49] [ff1af8c6f1c2f1c0e8def9bfc9355be9] [Current]
Feedback Forum

Post a new message
Dataseries X:
250643	276427	45390	114971	208512
243422	266424	39215	105531	205708
247105	267153	38433	104919	206890
248541	268381	37676	104782	207069
245039	262522	36055	101281	205305
237080	255542	32986	94545	201504
237085	253158	30953	93248	200517
225554	243803	23558	84031	195771
226839	250741	22487	87486	195259
247934	280445	43528	115867	197579
248333	285257	47913	120327	196985
246969	270976	48621	117008	194382
245098	261076	42169	108811	191580


Summary of computational transaction
Raw Inputview raw input (R code)
Raw Outputview raw output of R engine
Computing time9 seconds
R Server'George Udny Yule' @ 72.249.76.132

\begin{tabular}{lllllllll}
\hline
Summary of computational transaction \tabularnewline
Raw Input & view raw input (R code)  \tabularnewline
Raw Output & view raw output of R engine  \tabularnewline
Computing time & 9 seconds \tabularnewline
R Server & 'George Udny Yule' @ 72.249.76.132 \tabularnewline
\hline
\end{tabular}
%Source: https://freestatistics.org/blog/index.php?pk=24024&T=0

[TABLE]
[ROW][C]Summary of computational transaction[/C][/ROW]
[ROW][C]Raw Input[/C][C]view raw input (R code) [/C][/ROW]
[ROW][C]Raw Output[/C][C]view raw output of R engine [/C][/ROW]
[ROW][C]Computing time[/C][C]9 seconds[/C][/ROW]
[ROW][C]R Server[/C][C]'George Udny Yule' @ 72.249.76.132[/C][/ROW]
[/TABLE]
Source: https://freestatistics.org/blog/index.php?pk=24024&T=0

Globally Unique Identifier (entire table): ba.freestatistics.org/blog/index.php?pk=24024&T=0

As an alternative you can also use a QR Code:  

The GUIDs for individual cells are displayed in the table below:

Summary of computational transaction
Raw Inputview raw input (R code)
Raw Outputview raw output of R engine
Computing time9 seconds
R Server'George Udny Yule' @ 72.249.76.132


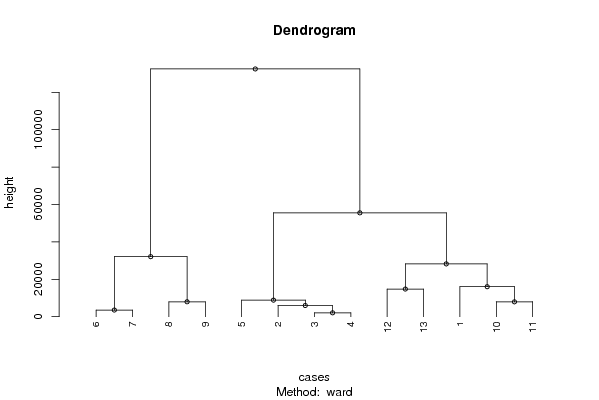
Summary of Dendrogram
LabelHeight
12047.91088673311
23531.70610328776
35957.32602496156
47923.83783276765
57945.64528531195
68842.14693843887
714770.9498001990
816016.2141931058
928225.7704180291
1032096.3568533159
1155519.4822246319
12132488.325970599

\begin{tabular}{lllllllll}
\hline
Summary of Dendrogram \tabularnewline
Label & Height \tabularnewline
1 & 2047.91088673311 \tabularnewline
2 & 3531.70610328776 \tabularnewline
3 & 5957.32602496156 \tabularnewline
4 & 7923.83783276765 \tabularnewline
5 & 7945.64528531195 \tabularnewline
6 & 8842.14693843887 \tabularnewline
7 & 14770.9498001990 \tabularnewline
8 & 16016.2141931058 \tabularnewline
9 & 28225.7704180291 \tabularnewline
10 & 32096.3568533159 \tabularnewline
11 & 55519.4822246319 \tabularnewline
12 & 132488.325970599 \tabularnewline
\hline
\end{tabular}
%Source: https://freestatistics.org/blog/index.php?pk=24024&T=1

[TABLE]
[ROW][C]Summary of Dendrogram[/C][/ROW]
[ROW][C]Label[/C][C]Height[/C][/ROW]
[ROW][C]1[/C][C]2047.91088673311[/C][/ROW]
[ROW][C]2[/C][C]3531.70610328776[/C][/ROW]
[ROW][C]3[/C][C]5957.32602496156[/C][/ROW]
[ROW][C]4[/C][C]7923.83783276765[/C][/ROW]
[ROW][C]5[/C][C]7945.64528531195[/C][/ROW]
[ROW][C]6[/C][C]8842.14693843887[/C][/ROW]
[ROW][C]7[/C][C]14770.9498001990[/C][/ROW]
[ROW][C]8[/C][C]16016.2141931058[/C][/ROW]
[ROW][C]9[/C][C]28225.7704180291[/C][/ROW]
[ROW][C]10[/C][C]32096.3568533159[/C][/ROW]
[ROW][C]11[/C][C]55519.4822246319[/C][/ROW]
[ROW][C]12[/C][C]132488.325970599[/C][/ROW]
[/TABLE]
Source: https://freestatistics.org/blog/index.php?pk=24024&T=1

Globally Unique Identifier (entire table): ba.freestatistics.org/blog/index.php?pk=24024&T=1

As an alternative you can also use a QR Code:  

The GUIDs for individual cells are displayed in the table below:

Summary of Dendrogram
LabelHeight
12047.91088673311
23531.70610328776
35957.32602496156
47923.83783276765
57945.64528531195
68842.14693843887
714770.9498001990
816016.2141931058
928225.7704180291
1032096.3568533159
1155519.4822246319
12132488.325970599


Parameters (Session):
par1 = ward ; par2 = ALL ; par3 = FALSE ; par4 = FALSE ;
Parameters (R input):
par1 = ward ; par2 = ALL ; par3 = FALSE ; par4 = FALSE ;
R code (references can be found in the software module):
par3 <- as.logical(par3)
par4 <- as.logical(par4)
if (par3 == 'TRUE'){
dum = xlab
xlab = ylab
ylab = dum
}
x <- t(y)
hc <- hclust(dist(x),method=par1)
d <- as.dendrogram(hc)
str(d)
mysub <- paste('Method: ',par1)
bitmap(file='test1.png')
if (par4 == 'TRUE'){
plot(d,main=main,ylab=ylab,xlab=xlab,horiz=par3, nodePar=list(pch = c(1,NA), cex=0.8, lab.cex = 0.8),type='t',center=T, sub=mysub)
} else {
plot(d,main=main,ylab=ylab,xlab=xlab,horiz=par3, nodePar=list(pch = c(1,NA), cex=0.8, lab.cex = 0.8), sub=mysub)
}
dev.off()
if (par2 != 'ALL'){
if (par3 == 'TRUE'){
ylab = 'cluster'
} else {
xlab = 'cluster'
}
par2 <- as.numeric(par2)
memb <- cutree(hc, k = par2)
cent <- NULL
for(k in 1:par2){
cent <- rbind(cent, colMeans(x[memb == k, , drop = FALSE]))
}
hc1 <- hclust(dist(cent),method=par1, members = table(memb))
de <- as.dendrogram(hc1)
bitmap(file='test2.png')
if (par4 == 'TRUE'){
plot(de,main=main,ylab=ylab,xlab=xlab,horiz=par3, nodePar=list(pch = c(1,NA), cex=0.8, lab.cex = 0.8),type='t',center=T, sub=mysub)
} else {
plot(de,main=main,ylab=ylab,xlab=xlab,horiz=par3, nodePar=list(pch = c(1,NA), cex=0.8, lab.cex = 0.8), sub=mysub)
}
dev.off()
str(de)
}
load(file='createtable')
a<-table.start()
a<-table.row.start(a)
a<-table.element(a,'Summary of Dendrogram',2,TRUE)
a<-table.row.end(a)
a<-table.row.start(a)
a<-table.element(a,'Label',header=TRUE)
a<-table.element(a,'Height',header=TRUE)
a<-table.row.end(a)
num <- length(x[,1])-1
for (i in 1:num)
{
a<-table.row.start(a)
a<-table.element(a,hc$labels[i])
a<-table.element(a,hc$height[i])
a<-table.row.end(a)
}
a<-table.end(a)
table.save(a,file='mytable1.tab')
if (par2 != 'ALL'){
a<-table.start()
a<-table.row.start(a)
a<-table.element(a,'Summary of Cut Dendrogram',2,TRUE)
a<-table.row.end(a)
a<-table.row.start(a)
a<-table.element(a,'Label',header=TRUE)
a<-table.element(a,'Height',header=TRUE)
a<-table.row.end(a)
num <- par2-1
for (i in 1:num)
{
a<-table.row.start(a)
a<-table.element(a,i)
a<-table.element(a,hc1$height[i])
a<-table.row.end(a)
}
a<-table.end(a)
table.save(a,file='mytable2.tab')
}