Free Statistics

of Irreproducible Research!

Author's title

Author*The author of this computation has been verified*
R Software Modulerwasp_hierarchicalclustering.wasp
Title produced by softwareHierarchical Clustering
Date of computationTue, 11 Nov 2008 13:56:26 -0700
Cite this page as followsStatistical Computations at FreeStatistics.org, Office for Research Development and Education, URL https://freestatistics.org/blog/index.php?v=date/2008/Nov/11/t122643704521840ndtvinfxc8.htm/, Retrieved Sun, 19 May 2024 11:15:46 +0000
Statistical Computations at FreeStatistics.org, Office for Research Development and Education, URL https://freestatistics.org/blog/index.php?pk=23959, Retrieved Sun, 19 May 2024 11:15:46 +0000
QR Codes:

Original text written by user:
IsPrivate?No (this computation is public)
User-defined keywords
Estimated Impact152
Family? (F = Feedback message, R = changed R code, M = changed R Module, P = changed Parameters, D = changed Data)
F     [Univariate Data Series] [Niet werkende wer...] [2008-10-13 17:30:07] [91d2608132ba5d00ecce3524d8276757]
F RMPD  [Partial Correlation] [Partial Correlati...] [2008-11-11 19:49:25] [deb3c14ac9e4607a6d84fc9d0e0e6cc2]
F    D    [Partial Correlation] [Partial Correlati...] [2008-11-11 19:56:04] [deb3c14ac9e4607a6d84fc9d0e0e6cc2]
F RMPD        [Hierarchical Clustering] [Hierarchical Clus...] [2008-11-11 20:56:26] [5e9e099b83e50415d7642e10d74756e4] [Current]
Feedback Forum
2008-11-17 20:11:07 [Ruben Jacobs] [reply
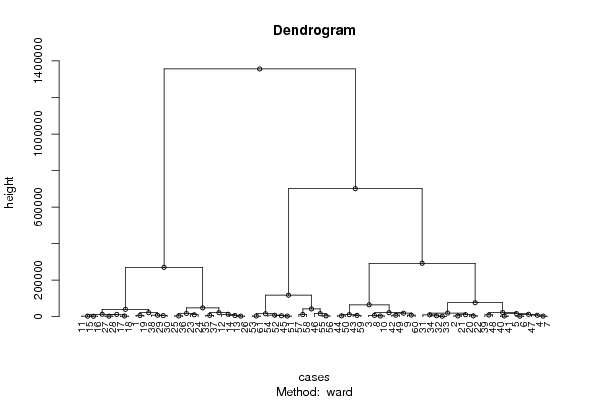
Volgens de figuur is er wel een patroon te herkennen. De Hierarchical Clustering gaat berekenen welke observaties samen gezien kunnen worden, welke observaties gelijkaardig zijn, en gaat dit vervolgens hiërarchisch opbouwen.

Deze techniek wordt meestal niet echt gebruikt voor tijdreeksen maar meer in de marketing. Aan de hand van deze techniek je een bepaalde segmentatie maken voor bijvoorbeeld je productrange.

Post a new message
Dataseries X:
577992	308347	121148	143119
565464	298427	114624	140353
547344	289231	109822	137149
554788	291975	112081	138301
562325	294912	113534	138709
560854	293488	112110	138619
555332	290555	109826	137528
543599	284736	107423	134523
536662	281818	105540	133593
542722	287854	108573	135647
593530	316263	128591	143541
610763	325412	139145	144024
612613	326011	129700	148607
611324	328282	132828	148881
594167	317480	126868	145447
595454	317539	128390	144170
590865	313737	126830	142148
589379	312276	124105	142492
584428	309391	122323	141703
573100	302950	119296	139116
567456	300316	116822	138461
569028	304035	119224	139870
620735	333476	139357	148703
628884	337698	144322	150034
628232	335932	133676	153670
612117	323931	128283	147508
595404	313927	121640	145150
597141	314485	122877	143955
593408	313218	117284	147608
590072	309664	116463	144839
579799	302963	112685	142096
574205	298989	113235	138941
572775	298423	111692	139093
572942	301631	113152	141526
619567	329765	129889	151492
625809	335083	131153	155217
619916	327616	123770	154530
587625	309119	112516	148533
565742	295916	105940	143923
557274	291413	104320	141075
560576	291542	103582	142261
548854	284678	99064	140435
531673	276475	94989	136169
525919	272566	92241	136107
511038	264981	89752	131063
498662	263290	90610	127765
555362	296806	109456	140731
564591	303598	110213	145981
541657	286994	97694	141834
527070	276427	91844	137625
509846	266424	87572	132515
514258	267153	89812	131111
516922	268381	89050	133603
507561	262522	85990	132207
492622	255542	85070	126488
490243	253158	83277	125933
469357	243803	79586	120927
477580	250741	84215	122597
528379	280445	99708	135437
533590	285257	100698	138649
517945	270976	90861	134576


Summary of computational transaction
Raw Inputview raw input (R code)
Raw Outputview raw output of R engine
Computing time3 seconds
R Server'Herman Ole Andreas Wold' @ 193.190.124.10:1001

\begin{tabular}{lllllllll}
\hline
Summary of computational transaction \tabularnewline
Raw Input & view raw input (R code)  \tabularnewline
Raw Output & view raw output of R engine  \tabularnewline
Computing time & 3 seconds \tabularnewline
R Server & 'Herman Ole Andreas Wold' @ 193.190.124.10:1001 \tabularnewline
\hline
\end{tabular}
%Source: https://freestatistics.org/blog/index.php?pk=23959&T=0

[TABLE]
[ROW][C]Summary of computational transaction[/C][/ROW]
[ROW][C]Raw Input[/C][C]view raw input (R code) [/C][/ROW]
[ROW][C]Raw Output[/C][C]view raw output of R engine [/C][/ROW]
[ROW][C]Computing time[/C][C]3 seconds[/C][/ROW]
[ROW][C]R Server[/C][C]'Herman Ole Andreas Wold' @ 193.190.124.10:1001[/C][/ROW]
[/TABLE]
Source: https://freestatistics.org/blog/index.php?pk=23959&T=0

Globally Unique Identifier (entire table): ba.freestatistics.org/blog/index.php?pk=23959&T=0

As an alternative you can also use a QR Code:  

The GUIDs for individual cells are displayed in the table below:

Summary of computational transaction
Raw Inputview raw input (R code)
Raw Outputview raw output of R engine
Computing time3 seconds
R Server'Herman Ole Andreas Wold' @ 193.190.124.10:1001


Summary of Dendrogram
LabelHeight
12183.85187226607
22367.92377411098
32495.49454016634
42507.33464060943
52753.85091336198
62790.71782880319
72827.5236515368
83219.28827538013
93447.70619397883
103465.1124079891
113587.62944017355
123616.20367236139
133855.64145117255
143917.96733013434
153993.40118195004
164281.60121917023
174323.66222084936
184734.06682819581
194979.99265338642
205665.79332485752
216118.12305458802
226774.7850888423
236828.16239785126
247029.66009135577
257170.18877017893
267772.25264897724
277779.16809762917
287809.91459620398
297812.50708600648
308382.83991258332
319101.19871225763
3210039.5147032413
3310519.2333846151
3410782.5454803425
3511115.2832321532
3611830.8965847902
3712376.9635768206
3812717.0355704633
3912925.990358942
4013146.2956435990
4116072.0681652787
4216406.9630718045
4317057.4124190422
4417176.4221736539
4518873.3598010776
4619531.7141747353
4721636.1280776242
4821730.8606724845
4921765.3925817096
5022786.7375979937
5140047.6493881032
5242370.8537642625
5348060.4661843552
5464846.8998253377
5576301.6680904305
56117614.043284568
57270138.507647124
58292189.585191177
59701036.294397947
601356372.14738273

\begin{tabular}{lllllllll}
\hline
Summary of Dendrogram \tabularnewline
Label & Height \tabularnewline
1 & 2183.85187226607 \tabularnewline
2 & 2367.92377411098 \tabularnewline
3 & 2495.49454016634 \tabularnewline
4 & 2507.33464060943 \tabularnewline
5 & 2753.85091336198 \tabularnewline
6 & 2790.71782880319 \tabularnewline
7 & 2827.5236515368 \tabularnewline
8 & 3219.28827538013 \tabularnewline
9 & 3447.70619397883 \tabularnewline
10 & 3465.1124079891 \tabularnewline
11 & 3587.62944017355 \tabularnewline
12 & 3616.20367236139 \tabularnewline
13 & 3855.64145117255 \tabularnewline
14 & 3917.96733013434 \tabularnewline
15 & 3993.40118195004 \tabularnewline
16 & 4281.60121917023 \tabularnewline
17 & 4323.66222084936 \tabularnewline
18 & 4734.06682819581 \tabularnewline
19 & 4979.99265338642 \tabularnewline
20 & 5665.79332485752 \tabularnewline
21 & 6118.12305458802 \tabularnewline
22 & 6774.7850888423 \tabularnewline
23 & 6828.16239785126 \tabularnewline
24 & 7029.66009135577 \tabularnewline
25 & 7170.18877017893 \tabularnewline
26 & 7772.25264897724 \tabularnewline
27 & 7779.16809762917 \tabularnewline
28 & 7809.91459620398 \tabularnewline
29 & 7812.50708600648 \tabularnewline
30 & 8382.83991258332 \tabularnewline
31 & 9101.19871225763 \tabularnewline
32 & 10039.5147032413 \tabularnewline
33 & 10519.2333846151 \tabularnewline
34 & 10782.5454803425 \tabularnewline
35 & 11115.2832321532 \tabularnewline
36 & 11830.8965847902 \tabularnewline
37 & 12376.9635768206 \tabularnewline
38 & 12717.0355704633 \tabularnewline
39 & 12925.990358942 \tabularnewline
40 & 13146.2956435990 \tabularnewline
41 & 16072.0681652787 \tabularnewline
42 & 16406.9630718045 \tabularnewline
43 & 17057.4124190422 \tabularnewline
44 & 17176.4221736539 \tabularnewline
45 & 18873.3598010776 \tabularnewline
46 & 19531.7141747353 \tabularnewline
47 & 21636.1280776242 \tabularnewline
48 & 21730.8606724845 \tabularnewline
49 & 21765.3925817096 \tabularnewline
50 & 22786.7375979937 \tabularnewline
51 & 40047.6493881032 \tabularnewline
52 & 42370.8537642625 \tabularnewline
53 & 48060.4661843552 \tabularnewline
54 & 64846.8998253377 \tabularnewline
55 & 76301.6680904305 \tabularnewline
56 & 117614.043284568 \tabularnewline
57 & 270138.507647124 \tabularnewline
58 & 292189.585191177 \tabularnewline
59 & 701036.294397947 \tabularnewline
60 & 1356372.14738273 \tabularnewline
\hline
\end{tabular}
%Source: https://freestatistics.org/blog/index.php?pk=23959&T=1

[TABLE]
[ROW][C]Summary of Dendrogram[/C][/ROW]
[ROW][C]Label[/C][C]Height[/C][/ROW]
[ROW][C]1[/C][C]2183.85187226607[/C][/ROW]
[ROW][C]2[/C][C]2367.92377411098[/C][/ROW]
[ROW][C]3[/C][C]2495.49454016634[/C][/ROW]
[ROW][C]4[/C][C]2507.33464060943[/C][/ROW]
[ROW][C]5[/C][C]2753.85091336198[/C][/ROW]
[ROW][C]6[/C][C]2790.71782880319[/C][/ROW]
[ROW][C]7[/C][C]2827.5236515368[/C][/ROW]
[ROW][C]8[/C][C]3219.28827538013[/C][/ROW]
[ROW][C]9[/C][C]3447.70619397883[/C][/ROW]
[ROW][C]10[/C][C]3465.1124079891[/C][/ROW]
[ROW][C]11[/C][C]3587.62944017355[/C][/ROW]
[ROW][C]12[/C][C]3616.20367236139[/C][/ROW]
[ROW][C]13[/C][C]3855.64145117255[/C][/ROW]
[ROW][C]14[/C][C]3917.96733013434[/C][/ROW]
[ROW][C]15[/C][C]3993.40118195004[/C][/ROW]
[ROW][C]16[/C][C]4281.60121917023[/C][/ROW]
[ROW][C]17[/C][C]4323.66222084936[/C][/ROW]
[ROW][C]18[/C][C]4734.06682819581[/C][/ROW]
[ROW][C]19[/C][C]4979.99265338642[/C][/ROW]
[ROW][C]20[/C][C]5665.79332485752[/C][/ROW]
[ROW][C]21[/C][C]6118.12305458802[/C][/ROW]
[ROW][C]22[/C][C]6774.7850888423[/C][/ROW]
[ROW][C]23[/C][C]6828.16239785126[/C][/ROW]
[ROW][C]24[/C][C]7029.66009135577[/C][/ROW]
[ROW][C]25[/C][C]7170.18877017893[/C][/ROW]
[ROW][C]26[/C][C]7772.25264897724[/C][/ROW]
[ROW][C]27[/C][C]7779.16809762917[/C][/ROW]
[ROW][C]28[/C][C]7809.91459620398[/C][/ROW]
[ROW][C]29[/C][C]7812.50708600648[/C][/ROW]
[ROW][C]30[/C][C]8382.83991258332[/C][/ROW]
[ROW][C]31[/C][C]9101.19871225763[/C][/ROW]
[ROW][C]32[/C][C]10039.5147032413[/C][/ROW]
[ROW][C]33[/C][C]10519.2333846151[/C][/ROW]
[ROW][C]34[/C][C]10782.5454803425[/C][/ROW]
[ROW][C]35[/C][C]11115.2832321532[/C][/ROW]
[ROW][C]36[/C][C]11830.8965847902[/C][/ROW]
[ROW][C]37[/C][C]12376.9635768206[/C][/ROW]
[ROW][C]38[/C][C]12717.0355704633[/C][/ROW]
[ROW][C]39[/C][C]12925.990358942[/C][/ROW]
[ROW][C]40[/C][C]13146.2956435990[/C][/ROW]
[ROW][C]41[/C][C]16072.0681652787[/C][/ROW]
[ROW][C]42[/C][C]16406.9630718045[/C][/ROW]
[ROW][C]43[/C][C]17057.4124190422[/C][/ROW]
[ROW][C]44[/C][C]17176.4221736539[/C][/ROW]
[ROW][C]45[/C][C]18873.3598010776[/C][/ROW]
[ROW][C]46[/C][C]19531.7141747353[/C][/ROW]
[ROW][C]47[/C][C]21636.1280776242[/C][/ROW]
[ROW][C]48[/C][C]21730.8606724845[/C][/ROW]
[ROW][C]49[/C][C]21765.3925817096[/C][/ROW]
[ROW][C]50[/C][C]22786.7375979937[/C][/ROW]
[ROW][C]51[/C][C]40047.6493881032[/C][/ROW]
[ROW][C]52[/C][C]42370.8537642625[/C][/ROW]
[ROW][C]53[/C][C]48060.4661843552[/C][/ROW]
[ROW][C]54[/C][C]64846.8998253377[/C][/ROW]
[ROW][C]55[/C][C]76301.6680904305[/C][/ROW]
[ROW][C]56[/C][C]117614.043284568[/C][/ROW]
[ROW][C]57[/C][C]270138.507647124[/C][/ROW]
[ROW][C]58[/C][C]292189.585191177[/C][/ROW]
[ROW][C]59[/C][C]701036.294397947[/C][/ROW]
[ROW][C]60[/C][C]1356372.14738273[/C][/ROW]
[/TABLE]
Source: https://freestatistics.org/blog/index.php?pk=23959&T=1

Globally Unique Identifier (entire table): ba.freestatistics.org/blog/index.php?pk=23959&T=1

As an alternative you can also use a QR Code:  

The GUIDs for individual cells are displayed in the table below:

Summary of Dendrogram
LabelHeight
12183.85187226607
22367.92377411098
32495.49454016634
42507.33464060943
52753.85091336198
62790.71782880319
72827.5236515368
83219.28827538013
93447.70619397883
103465.1124079891
113587.62944017355
123616.20367236139
133855.64145117255
143917.96733013434
153993.40118195004
164281.60121917023
174323.66222084936
184734.06682819581
194979.99265338642
205665.79332485752
216118.12305458802
226774.7850888423
236828.16239785126
247029.66009135577
257170.18877017893
267772.25264897724
277779.16809762917
287809.91459620398
297812.50708600648
308382.83991258332
319101.19871225763
3210039.5147032413
3310519.2333846151
3410782.5454803425
3511115.2832321532
3611830.8965847902
3712376.9635768206
3812717.0355704633
3912925.990358942
4013146.2956435990
4116072.0681652787
4216406.9630718045
4317057.4124190422
4417176.4221736539
4518873.3598010776
4619531.7141747353
4721636.1280776242
4821730.8606724845
4921765.3925817096
5022786.7375979937
5140047.6493881032
5242370.8537642625
5348060.4661843552
5464846.8998253377
5576301.6680904305
56117614.043284568
57270138.507647124
58292189.585191177
59701036.294397947
601356372.14738273


Parameters (Session):
par1 = ward ; par2 = ALL ; par3 = FALSE ; par4 = FALSE ;
Parameters (R input):
par1 = ward ; par2 = ALL ; par3 = FALSE ; par4 = FALSE ;
R code (references can be found in the software module):
par3 <- as.logical(par3)
par4 <- as.logical(par4)
if (par3 == 'TRUE'){
dum = xlab
xlab = ylab
ylab = dum
}
x <- t(y)
hc <- hclust(dist(x),method=par1)
d <- as.dendrogram(hc)
str(d)
mysub <- paste('Method: ',par1)
bitmap(file='test1.png')
if (par4 == 'TRUE'){
plot(d,main=main,ylab=ylab,xlab=xlab,horiz=par3, nodePar=list(pch = c(1,NA), cex=0.8, lab.cex = 0.8),type='t',center=T, sub=mysub)
} else {
plot(d,main=main,ylab=ylab,xlab=xlab,horiz=par3, nodePar=list(pch = c(1,NA), cex=0.8, lab.cex = 0.8), sub=mysub)
}
dev.off()
if (par2 != 'ALL'){
if (par3 == 'TRUE'){
ylab = 'cluster'
} else {
xlab = 'cluster'
}
par2 <- as.numeric(par2)
memb <- cutree(hc, k = par2)
cent <- NULL
for(k in 1:par2){
cent <- rbind(cent, colMeans(x[memb == k, , drop = FALSE]))
}
hc1 <- hclust(dist(cent),method=par1, members = table(memb))
de <- as.dendrogram(hc1)
bitmap(file='test2.png')
if (par4 == 'TRUE'){
plot(de,main=main,ylab=ylab,xlab=xlab,horiz=par3, nodePar=list(pch = c(1,NA), cex=0.8, lab.cex = 0.8),type='t',center=T, sub=mysub)
} else {
plot(de,main=main,ylab=ylab,xlab=xlab,horiz=par3, nodePar=list(pch = c(1,NA), cex=0.8, lab.cex = 0.8), sub=mysub)
}
dev.off()
str(de)
}
load(file='createtable')
a<-table.start()
a<-table.row.start(a)
a<-table.element(a,'Summary of Dendrogram',2,TRUE)
a<-table.row.end(a)
a<-table.row.start(a)
a<-table.element(a,'Label',header=TRUE)
a<-table.element(a,'Height',header=TRUE)
a<-table.row.end(a)
num <- length(x[,1])-1
for (i in 1:num)
{
a<-table.row.start(a)
a<-table.element(a,hc$labels[i])
a<-table.element(a,hc$height[i])
a<-table.row.end(a)
}
a<-table.end(a)
table.save(a,file='mytable1.tab')
if (par2 != 'ALL'){
a<-table.start()
a<-table.row.start(a)
a<-table.element(a,'Summary of Cut Dendrogram',2,TRUE)
a<-table.row.end(a)
a<-table.row.start(a)
a<-table.element(a,'Label',header=TRUE)
a<-table.element(a,'Height',header=TRUE)
a<-table.row.end(a)
num <- par2-1
for (i in 1:num)
{
a<-table.row.start(a)
a<-table.element(a,i)
a<-table.element(a,hc1$height[i])
a<-table.row.end(a)
}
a<-table.end(a)
table.save(a,file='mytable2.tab')
}