Free Statistics

of Irreproducible Research!

Author's title

Author*Unverified author*
R Software Modulerwasp_boxcoxlin.wasp
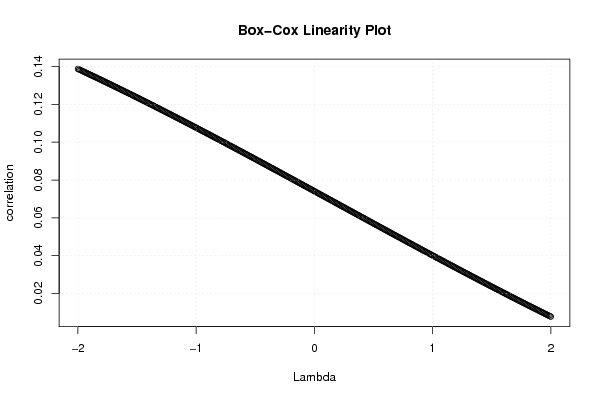
Title produced by softwareBox-Cox Linearity Plot
Date of computationTue, 11 Nov 2008 13:27:45 -0700
Cite this page as followsStatistical Computations at FreeStatistics.org, Office for Research Development and Education, URL https://freestatistics.org/blog/index.php?v=date/2008/Nov/11/t1226435408ezu93iuaecpkdzb.htm/, Retrieved Sun, 19 May 2024 08:44:51 +0000
Statistical Computations at FreeStatistics.org, Office for Research Development and Education, URL https://freestatistics.org/blog/index.php?pk=23933, Retrieved Sun, 19 May 2024 08:44:51 +0000
QR Codes:

Original text written by user:
IsPrivate?No (this computation is public)
User-defined keywords
Estimated Impact140
Family? (F = Feedback message, R = changed R code, M = changed R Module, P = changed Parameters, D = changed Data)
F       [Box-Cox Linearity Plot] [] [2008-11-11 20:27:45] [d41d8cd98f00b204e9800998ecf8427e] [Current]
-    D    [Box-Cox Linearity Plot] [box-cox linearity...] [2008-11-22 15:41:17] [a4602103a5e123497aa555277d0e627b]
Feedback Forum
2008-11-18 09:28:15 [Evelyn Gabriel] [reply
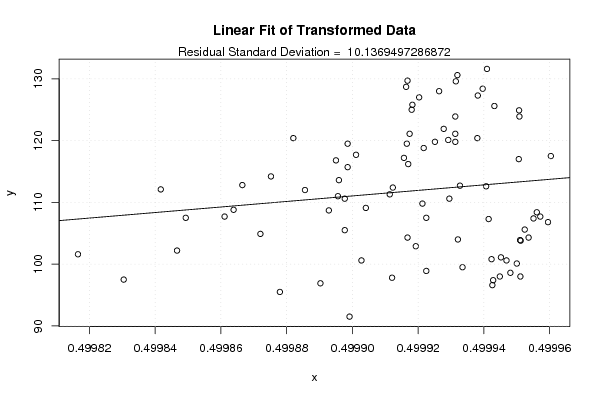
Hier kan je zien dat de gegevens een meer lineair verband krijgen, hoewel de transformatie niet zoveel invloed heeft gehad.
2008-11-20 10:34:14 [Angelique Van de Vijver] [reply
Goede conclusie over die minimale verandering van de standaardafwijking en dat de transformatie niet veel nut heeft. Op de box-cox linearity plot zien we inderdaad dat -2 de optimale lambda-waarde is omdat hier zich het maximum bevindt. Deze lambda zal dus het beste resultaat geven om de gegevens meer lineair te maken.
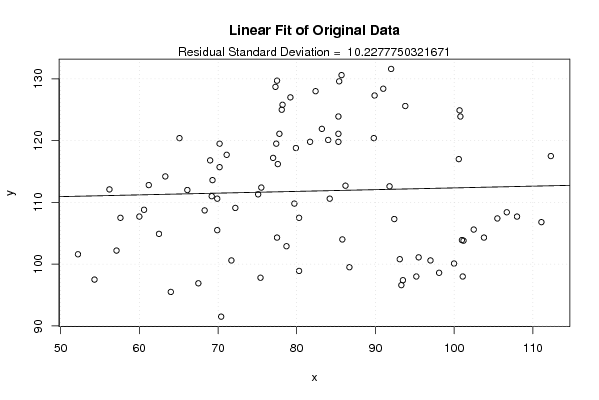
We kunnen op de grafieken inderdaad vaststellen dat de transformatie weinig invloed heeft omdat er weinig verandert op de grafieken. Ook de standaardafwijking is amper veranderd door de transformatie (10.22 ><10.13).
Goed om nog bijkomende test te doen.
2008-11-22 15:48:36 [An Knapen] [reply
Box-Cox linearity plot wordt gebruikt om twee variabelen met elkaar in verband te brengen. Er werd vermeld dat je het verband heb onderzocht tussen consumptiegoederen en duurzame goederen. Ik vind echter de gegevens niet terug dieje zou gebruikt hebben voor duurzame goederen. Daarom heb ik de berekening opnieuw gedaan,maar heb in de plaats van duurzame goederen, investeringsgoederen genomen.

http://www.freestatistics.org/blog/index.php?v=date/2008/Nov/22/t1227368536e1zb0vcoaejxokp.htm
Als ik deze grafiek dan vergelijk met die van jou, zie ik toch wel een heel andere vorm.(die van mij is lichtjes gebogen en is stijgend, die van jou is een rechte en dalend)

Het maximum bevindt zich in het punt: (2;0.612603162482275)Dit betekent dat in dat punt de correlatie het grootst is en dus de regressierechte het best benaderd wordt.
Wanneer er dan een transformatie wordt toegepast, is er inderdaad weinig verschil/verbetering merkbaar. De transformatie is hier dus niet bruikbaar, want de correlatie wordt niet echt verbeterd.


Post a new message
Dataseries X:
98,1
101,1
111,1
93,3
100
108
70,4
75,4
105,5
112,3
102,5
93,5
86,7
95,2
103,8
97
95,5
101
67,5
64
106,7
100,6
101,2
93,1
84,2
85,8
91,8
92,4
80,3
79,7
62,5
57,1
100,8
100,7
86,2
83,2
71,7
77,5
89,8
80,3
78,7
93,8
57,6
60,6
91
85,3
77,4
77,3
68,3
69,9
81,7
75,1
69,9
84
54,3
60
89,9
77
85,3
77,6
69,2
75,5
85,7
72,2
79,9
85,3
52,2
61,2
82,4
85,4
78,2
70,2
70,2
69,3
77,5
66,1
69
79,2
56,2
63,3
77,8
92
78,1
65,1
71,1
Dataseries Y:
98,6
98
106,8
96,6
100,1
107,7
91,5
97,8
107,4
117,5
105,6
97,4
99,5
98
104,3
100,6
101,1
103,9
96,9
95,5
108,4
117
103,8
100,8
110,6
104
112,6
107,3
98,9
109,8
104,9
102,2
123,9
124,9
112,7
121,9
100,6
104,3
120,4
107,5
102,9
125,6
107,5
108,8
128,4
121,1
119,5
128,7
108,7
105,5
119,8
111,3
110,6
120,1
97,5
107,7
127,3
117,2
119,8
116,2
111
112,4
130,6
109,1
118,8
123,9
101,6
112,8
128
129,6
125,8
119,5
115,7
113,6
129,7
112
116,8
127
112,1
114,2
121,1
131,6
125
120,4
117,7


Summary of computational transaction
Raw Inputview raw input (R code)
Raw Outputview raw output of R engine
Computing time3 seconds
R Server'Sir Ronald Aylmer Fisher' @ 193.190.124.24

\begin{tabular}{lllllllll}
\hline
Summary of computational transaction \tabularnewline
Raw Input & view raw input (R code)  \tabularnewline
Raw Output & view raw output of R engine  \tabularnewline
Computing time & 3 seconds \tabularnewline
R Server & 'Sir Ronald Aylmer Fisher' @ 193.190.124.24 \tabularnewline
\hline
\end{tabular}
%Source: https://freestatistics.org/blog/index.php?pk=23933&T=0

[TABLE]
[ROW][C]Summary of computational transaction[/C][/ROW]
[ROW][C]Raw Input[/C][C]view raw input (R code) [/C][/ROW]
[ROW][C]Raw Output[/C][C]view raw output of R engine [/C][/ROW]
[ROW][C]Computing time[/C][C]3 seconds[/C][/ROW]
[ROW][C]R Server[/C][C]'Sir Ronald Aylmer Fisher' @ 193.190.124.24[/C][/ROW]
[/TABLE]
Source: https://freestatistics.org/blog/index.php?pk=23933&T=0

Globally Unique Identifier (entire table): ba.freestatistics.org/blog/index.php?pk=23933&T=0

As an alternative you can also use a QR Code:  

The GUIDs for individual cells are displayed in the table below:

Summary of computational transaction
Raw Inputview raw input (R code)
Raw Outputview raw output of R engine
Computing time3 seconds
R Server'Sir Ronald Aylmer Fisher' @ 193.190.124.24


Box-Cox Linearity Plot
# observations x85
maximum correlation0.138778442715713
optimal lambda(x)-2
Residual SD (orginial)10.2277750321671
Residual SD (transformed)10.1369497286872

\begin{tabular}{lllllllll}
\hline
Box-Cox Linearity Plot \tabularnewline
# observations x & 85 \tabularnewline
maximum correlation & 0.138778442715713 \tabularnewline
optimal lambda(x) & -2 \tabularnewline
Residual SD (orginial) & 10.2277750321671 \tabularnewline
Residual SD (transformed) & 10.1369497286872 \tabularnewline
\hline
\end{tabular}
%Source: https://freestatistics.org/blog/index.php?pk=23933&T=1

[TABLE]
[ROW][C]Box-Cox Linearity Plot[/C][/ROW]
[ROW][C]# observations x[/C][C]85[/C][/ROW]
[ROW][C]maximum correlation[/C][C]0.138778442715713[/C][/ROW]
[ROW][C]optimal lambda(x)[/C][C]-2[/C][/ROW]
[ROW][C]Residual SD (orginial)[/C][C]10.2277750321671[/C][/ROW]
[ROW][C]Residual SD (transformed)[/C][C]10.1369497286872[/C][/ROW]
[/TABLE]
Source: https://freestatistics.org/blog/index.php?pk=23933&T=1

Globally Unique Identifier (entire table): ba.freestatistics.org/blog/index.php?pk=23933&T=1

As an alternative you can also use a QR Code:  

The GUIDs for individual cells are displayed in the table below:

Box-Cox Linearity Plot
# observations x85
maximum correlation0.138778442715713
optimal lambda(x)-2
Residual SD (orginial)10.2277750321671
Residual SD (transformed)10.1369497286872


Parameters (Session):
Parameters (R input):
R code (references can be found in the software module):
n <- length(x)
c <- array(NA,dim=c(401))
l <- array(NA,dim=c(401))
mx <- 0
mxli <- -999
for (i in 1:401)
{
l[i] <- (i-201)/100
if (l[i] != 0)
{
x1 <- (x^l[i] - 1) / l[i]
} else {
x1 <- log(x)
}
c[i] <- cor(x1,y)
if (mx < abs(c[i]))
{
mx <- abs(c[i])
mxli <- l[i]
}
}
c
mx
mxli
if (mxli != 0)
{
x1 <- (x^mxli - 1) / mxli
} else {
x1 <- log(x)
}
r<-lm(y~x)
se <- sqrt(var(r$residuals))
r1 <- lm(y~x1)
se1 <- sqrt(var(r1$residuals))
bitmap(file='test1.png')
plot(l,c,main='Box-Cox Linearity Plot',xlab='Lambda',ylab='correlation')
grid()
dev.off()
bitmap(file='test2.png')
plot(x,y,main='Linear Fit of Original Data',xlab='x',ylab='y')
abline(r)
grid()
mtext(paste('Residual Standard Deviation = ',se))
dev.off()
bitmap(file='test3.png')
plot(x1,y,main='Linear Fit of Transformed Data',xlab='x',ylab='y')
abline(r1)
grid()
mtext(paste('Residual Standard Deviation = ',se1))
dev.off()
load(file='createtable')
a<-table.start()
a<-table.row.start(a)
a<-table.element(a,'Box-Cox Linearity Plot',2,TRUE)
a<-table.row.end(a)
a<-table.row.start(a)
a<-table.element(a,'# observations x',header=TRUE)
a<-table.element(a,n)
a<-table.row.end(a)
a<-table.row.start(a)
a<-table.element(a,'maximum correlation',header=TRUE)
a<-table.element(a,mx)
a<-table.row.end(a)
a<-table.row.start(a)
a<-table.element(a,'optimal lambda(x)',header=TRUE)
a<-table.element(a,mxli)
a<-table.row.end(a)
a<-table.row.start(a)
a<-table.element(a,'Residual SD (orginial)',header=TRUE)
a<-table.element(a,se)
a<-table.row.end(a)
a<-table.row.start(a)
a<-table.element(a,'Residual SD (transformed)',header=TRUE)
a<-table.element(a,se1)
a<-table.row.end(a)
a<-table.end(a)
table.save(a,file='mytable.tab')