Free Statistics

of Irreproducible Research!

Author's title

Author*The author of this computation has been verified*
R Software Modulerwasp_hierarchicalclustering.wasp
Title produced by softwareHierarchical Clustering
Date of computationTue, 11 Nov 2008 13:01:31 -0700
Cite this page as followsStatistical Computations at FreeStatistics.org, Office for Research Development and Education, URL https://freestatistics.org/blog/index.php?v=date/2008/Nov/11/t1226433741px82dqeumwzne8e.htm/, Retrieved Sun, 19 May 2024 10:46:45 +0000
Statistical Computations at FreeStatistics.org, Office for Research Development and Education, URL https://freestatistics.org/blog/index.php?pk=23915, Retrieved Sun, 19 May 2024 10:46:45 +0000
QR Codes:

Original text written by user:
IsPrivate?No (this computation is public)
User-defined keywords
Estimated Impact115
Family? (F = Feedback message, R = changed R code, M = changed R Module, P = changed Parameters, D = changed Data)
F     [Hierarchical Clustering] [Hierarchical Clus...] [2008-11-10 13:48:21] [4300be8b33fd3dcdacd2aa9800ceba23]
F         [Hierarchical Clustering] [] [2008-11-11 20:01:31] [e8f764b122b426f433a1e1038b457077] [Current]
Feedback Forum
2008-11-24 10:44:23 [Stefanie Mertens] [reply
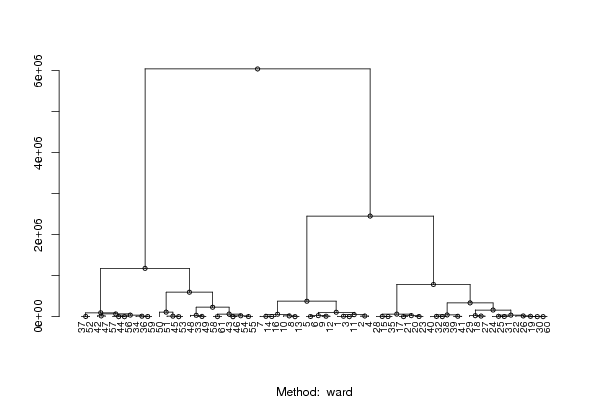
Om tijdreeksen in clusters op te delen wordt gebruik gemaakt van een dendogram.
De bedoeling hiervan is om inzicht te krijgen in welke observaties van de tijdreeks gelijkaardig zijn. De puntjes in het dendrogram zijn observaties. Hier worden clusters van gemaakt en onderverdeeld.
2008-11-24 16:17:30 [Bernard Femont] [reply
Hierarchical clustering geeft de clustering van de verschillende maandresultaten weer. Deze methode geeft iedere observatie een volgnummer en laat toe na te gaan welke van de verschillende observaties als gemeenschappelijk beschouwd kunnen worden. Deze methode wordt veelal toegepast op niet-tijdreeksen. Met deze clusteringtechniek gaat men zien welke observaties als gemeenschappelijk kunnen gezien worden in een bepaalde periode. In dit geval vallen de observaties in 2 groepen en deze groepen zijn telkens nog eens onderverdeeld in verschillende categorieën tot men op 1 observatie komt. Meestal gebruikt men deze techniek voor niet-tijdreeksen vb: hulpmiddel voor de marketing (vb marktsegmentatie).
Op het eerste zicht zien we de tak uiteenvallen in 2 subtakken en als je dan naar deze 2 subtakken kijkt zie je dat de rechtertak dichter bevolkt is dan de linkertak.
2008-11-24 18:05:19 [Toon Nauwelaerts] [reply
Je ziet inderdaad duidelijk een indeling in 2 takken, de rechtertak is groter.

Post a new message
Dataseries X:
356.2	152823.6	3	12.9
359.5	123780.5	2.9	13.6
368.4	159987.1	2.9	13.7
371	139603.7	2.8	14.1
397.5	177831.2	2.6	15.2
416.7	173656.9	2.5	15.7
413.2	252392	2.8	13
424.3	228029	2.8	13
415	197300	2.8	12.9
421.7	214088	2.7	13.2
422.1	160275	2.7	13.1
429.2	186851	2.7	13.6
452.1	227777	2.5	14.4
471.5	246899	2.4	14.9
488.3	295338	2.3	15.3
506.2	243847	2.3	15.8
517.3	324602	2.2	16.2
538.6	347066	2.3	15.8
545.3	407916	2.6	12.8
546.7	312914	2.7	12.3
540.3	326127	2.7	12.3
549.2	394369	2.6	12.6
563.9	310078	2.5	12.9
581.7	422770	2.5	12.9
590.7	417974	2.4	13.4
594.1	402347	2.5	13.1
604	360809	2.4	13.1
628.1	298289	2.3	13.7
662.4	375873	2.2	14.5
688.6	407210	2.2	15
705.9	413968	2.3	15
701.5	457532	2.4	14.3
686.2	695731	2.5	13.5
645.7	544623	2.5	12.7
668.7	292833	2.4	13.1
696.7	534403	2.4	13.3
715.5	517030	2.3	13.8
741.4	455714	2.2	14
754.3	471401	2.2	14.1
771.3	451493	2	15
797.7	480615	2	15.2
809.9	568272	2.2	14.2
790.1	650780	2.4	12.7
830.3	553643	2.4	13
847.7	780711	2.3	13.2
834.8	650724	2.4	13
824.5	586345	2.5	12.4
764.6	725173	2.5	12.3
780	701257	2.6	11.9
803.2	859063	2.5	12.2
751.1	789842	2.7	11.5
755.2	512707	2.7	11.4
708.2	780845	3.1	10.1
685.4	637804	3	10.4
680	640694	3.4	10.7
710.6	553416	3.3	11.2
702.8	554622	3.5	10.7
656.3	616736	4.1	9.2
575.6	536994	4.7	7.6
567.2	407237	4.4	8
545.2	618796	5.4	6.6


Summary of computational transaction
Raw Inputview raw input (R code)
Raw Outputview raw output of R engine
Computing time2 seconds
R Server'Sir Ronald Aylmer Fisher' @ 193.190.124.24

\begin{tabular}{lllllllll}
\hline
Summary of computational transaction \tabularnewline
Raw Input & view raw input (R code)  \tabularnewline
Raw Output & view raw output of R engine  \tabularnewline
Computing time & 2 seconds \tabularnewline
R Server & 'Sir Ronald Aylmer Fisher' @ 193.190.124.24 \tabularnewline
\hline
\end{tabular}
%Source: https://freestatistics.org/blog/index.php?pk=23915&T=0

[TABLE]
[ROW][C]Summary of computational transaction[/C][/ROW]
[ROW][C]Raw Input[/C][C]view raw input (R code) [/C][/ROW]
[ROW][C]Raw Output[/C][C]view raw output of R engine [/C][/ROW]
[ROW][C]Computing time[/C][C]2 seconds[/C][/ROW]
[ROW][C]R Server[/C][C]'Sir Ronald Aylmer Fisher' @ 193.190.124.24[/C][/ROW]
[/TABLE]
Source: https://freestatistics.org/blog/index.php?pk=23915&T=0

Globally Unique Identifier (entire table): ba.freestatistics.org/blog/index.php?pk=23915&T=0

As an alternative you can also use a QR Code:  

The GUIDs for individual cells are displayed in the table below:

Summary of computational transaction
Raw Inputview raw input (R code)
Raw Outputview raw output of R engine
Computing time2 seconds
R Server'Sir Ronald Aylmer Fisher' @ 193.190.124.24


Summary of Dendrogram
LabelHeight
171.6531925318055
2124.582502784300
3193.459298044834
4253.532818388468
5256.634253364589
6292.866010318706
7891.65398990007
81376.65271777009
91525.17850102865
101818.43782956691
112062.99579737817
122511.48840530869
132593.83576773858
142836.05222800991
152890.00508823082
163052.19739040580
174007.65637374264
184174.34418681548
194323.18297207046
204769.81126172688
215526.79626999223
226234.19368602382
237407.54553219458
247730.03783438595
258341.81171118877
269214.10227911542
279645.84589400013
2810449.0096726915
2911035.0223067666
3012021.2559215867
3113743.1558770175
3215823.2041872056
3317209.2025249430
3418073.0059893201
3518335.5117630905
3621526.7121697593
3724666.5342516227
3825351.258154075
3925556.4504791965
4033729.8074901515
4137133.7729956332
4238031.8360255116
4341878.6417124545
4448938.1633974727
4558252.661344417
4661681.799869617
4763088.5291410162
4866197.7512619982
4994376.9183873508
50107328.861374614
51109841.866183081
52161090.048119989
53229807.967157944
54335788.983949456
55376208.566570517
56596416.474463056
57784768.613751835
581178542.99842793
592453703.56788934
606043367.08905466

\begin{tabular}{lllllllll}
\hline
Summary of Dendrogram \tabularnewline
Label & Height \tabularnewline
1 & 71.6531925318055 \tabularnewline
2 & 124.582502784300 \tabularnewline
3 & 193.459298044834 \tabularnewline
4 & 253.532818388468 \tabularnewline
5 & 256.634253364589 \tabularnewline
6 & 292.866010318706 \tabularnewline
7 & 891.65398990007 \tabularnewline
8 & 1376.65271777009 \tabularnewline
9 & 1525.17850102865 \tabularnewline
10 & 1818.43782956691 \tabularnewline
11 & 2062.99579737817 \tabularnewline
12 & 2511.48840530869 \tabularnewline
13 & 2593.83576773858 \tabularnewline
14 & 2836.05222800991 \tabularnewline
15 & 2890.00508823082 \tabularnewline
16 & 3052.19739040580 \tabularnewline
17 & 4007.65637374264 \tabularnewline
18 & 4174.34418681548 \tabularnewline
19 & 4323.18297207046 \tabularnewline
20 & 4769.81126172688 \tabularnewline
21 & 5526.79626999223 \tabularnewline
22 & 6234.19368602382 \tabularnewline
23 & 7407.54553219458 \tabularnewline
24 & 7730.03783438595 \tabularnewline
25 & 8341.81171118877 \tabularnewline
26 & 9214.10227911542 \tabularnewline
27 & 9645.84589400013 \tabularnewline
28 & 10449.0096726915 \tabularnewline
29 & 11035.0223067666 \tabularnewline
30 & 12021.2559215867 \tabularnewline
31 & 13743.1558770175 \tabularnewline
32 & 15823.2041872056 \tabularnewline
33 & 17209.2025249430 \tabularnewline
34 & 18073.0059893201 \tabularnewline
35 & 18335.5117630905 \tabularnewline
36 & 21526.7121697593 \tabularnewline
37 & 24666.5342516227 \tabularnewline
38 & 25351.258154075 \tabularnewline
39 & 25556.4504791965 \tabularnewline
40 & 33729.8074901515 \tabularnewline
41 & 37133.7729956332 \tabularnewline
42 & 38031.8360255116 \tabularnewline
43 & 41878.6417124545 \tabularnewline
44 & 48938.1633974727 \tabularnewline
45 & 58252.661344417 \tabularnewline
46 & 61681.799869617 \tabularnewline
47 & 63088.5291410162 \tabularnewline
48 & 66197.7512619982 \tabularnewline
49 & 94376.9183873508 \tabularnewline
50 & 107328.861374614 \tabularnewline
51 & 109841.866183081 \tabularnewline
52 & 161090.048119989 \tabularnewline
53 & 229807.967157944 \tabularnewline
54 & 335788.983949456 \tabularnewline
55 & 376208.566570517 \tabularnewline
56 & 596416.474463056 \tabularnewline
57 & 784768.613751835 \tabularnewline
58 & 1178542.99842793 \tabularnewline
59 & 2453703.56788934 \tabularnewline
60 & 6043367.08905466 \tabularnewline
\hline
\end{tabular}
%Source: https://freestatistics.org/blog/index.php?pk=23915&T=1

[TABLE]
[ROW][C]Summary of Dendrogram[/C][/ROW]
[ROW][C]Label[/C][C]Height[/C][/ROW]
[ROW][C]1[/C][C]71.6531925318055[/C][/ROW]
[ROW][C]2[/C][C]124.582502784300[/C][/ROW]
[ROW][C]3[/C][C]193.459298044834[/C][/ROW]
[ROW][C]4[/C][C]253.532818388468[/C][/ROW]
[ROW][C]5[/C][C]256.634253364589[/C][/ROW]
[ROW][C]6[/C][C]292.866010318706[/C][/ROW]
[ROW][C]7[/C][C]891.65398990007[/C][/ROW]
[ROW][C]8[/C][C]1376.65271777009[/C][/ROW]
[ROW][C]9[/C][C]1525.17850102865[/C][/ROW]
[ROW][C]10[/C][C]1818.43782956691[/C][/ROW]
[ROW][C]11[/C][C]2062.99579737817[/C][/ROW]
[ROW][C]12[/C][C]2511.48840530869[/C][/ROW]
[ROW][C]13[/C][C]2593.83576773858[/C][/ROW]
[ROW][C]14[/C][C]2836.05222800991[/C][/ROW]
[ROW][C]15[/C][C]2890.00508823082[/C][/ROW]
[ROW][C]16[/C][C]3052.19739040580[/C][/ROW]
[ROW][C]17[/C][C]4007.65637374264[/C][/ROW]
[ROW][C]18[/C][C]4174.34418681548[/C][/ROW]
[ROW][C]19[/C][C]4323.18297207046[/C][/ROW]
[ROW][C]20[/C][C]4769.81126172688[/C][/ROW]
[ROW][C]21[/C][C]5526.79626999223[/C][/ROW]
[ROW][C]22[/C][C]6234.19368602382[/C][/ROW]
[ROW][C]23[/C][C]7407.54553219458[/C][/ROW]
[ROW][C]24[/C][C]7730.03783438595[/C][/ROW]
[ROW][C]25[/C][C]8341.81171118877[/C][/ROW]
[ROW][C]26[/C][C]9214.10227911542[/C][/ROW]
[ROW][C]27[/C][C]9645.84589400013[/C][/ROW]
[ROW][C]28[/C][C]10449.0096726915[/C][/ROW]
[ROW][C]29[/C][C]11035.0223067666[/C][/ROW]
[ROW][C]30[/C][C]12021.2559215867[/C][/ROW]
[ROW][C]31[/C][C]13743.1558770175[/C][/ROW]
[ROW][C]32[/C][C]15823.2041872056[/C][/ROW]
[ROW][C]33[/C][C]17209.2025249430[/C][/ROW]
[ROW][C]34[/C][C]18073.0059893201[/C][/ROW]
[ROW][C]35[/C][C]18335.5117630905[/C][/ROW]
[ROW][C]36[/C][C]21526.7121697593[/C][/ROW]
[ROW][C]37[/C][C]24666.5342516227[/C][/ROW]
[ROW][C]38[/C][C]25351.258154075[/C][/ROW]
[ROW][C]39[/C][C]25556.4504791965[/C][/ROW]
[ROW][C]40[/C][C]33729.8074901515[/C][/ROW]
[ROW][C]41[/C][C]37133.7729956332[/C][/ROW]
[ROW][C]42[/C][C]38031.8360255116[/C][/ROW]
[ROW][C]43[/C][C]41878.6417124545[/C][/ROW]
[ROW][C]44[/C][C]48938.1633974727[/C][/ROW]
[ROW][C]45[/C][C]58252.661344417[/C][/ROW]
[ROW][C]46[/C][C]61681.799869617[/C][/ROW]
[ROW][C]47[/C][C]63088.5291410162[/C][/ROW]
[ROW][C]48[/C][C]66197.7512619982[/C][/ROW]
[ROW][C]49[/C][C]94376.9183873508[/C][/ROW]
[ROW][C]50[/C][C]107328.861374614[/C][/ROW]
[ROW][C]51[/C][C]109841.866183081[/C][/ROW]
[ROW][C]52[/C][C]161090.048119989[/C][/ROW]
[ROW][C]53[/C][C]229807.967157944[/C][/ROW]
[ROW][C]54[/C][C]335788.983949456[/C][/ROW]
[ROW][C]55[/C][C]376208.566570517[/C][/ROW]
[ROW][C]56[/C][C]596416.474463056[/C][/ROW]
[ROW][C]57[/C][C]784768.613751835[/C][/ROW]
[ROW][C]58[/C][C]1178542.99842793[/C][/ROW]
[ROW][C]59[/C][C]2453703.56788934[/C][/ROW]
[ROW][C]60[/C][C]6043367.08905466[/C][/ROW]
[/TABLE]
Source: https://freestatistics.org/blog/index.php?pk=23915&T=1

Globally Unique Identifier (entire table): ba.freestatistics.org/blog/index.php?pk=23915&T=1

As an alternative you can also use a QR Code:  

The GUIDs for individual cells are displayed in the table below:

Summary of Dendrogram
LabelHeight
171.6531925318055
2124.582502784300
3193.459298044834
4253.532818388468
5256.634253364589
6292.866010318706
7891.65398990007
81376.65271777009
91525.17850102865
101818.43782956691
112062.99579737817
122511.48840530869
132593.83576773858
142836.05222800991
152890.00508823082
163052.19739040580
174007.65637374264
184174.34418681548
194323.18297207046
204769.81126172688
215526.79626999223
226234.19368602382
237407.54553219458
247730.03783438595
258341.81171118877
269214.10227911542
279645.84589400013
2810449.0096726915
2911035.0223067666
3012021.2559215867
3113743.1558770175
3215823.2041872056
3317209.2025249430
3418073.0059893201
3518335.5117630905
3621526.7121697593
3724666.5342516227
3825351.258154075
3925556.4504791965
4033729.8074901515
4137133.7729956332
4238031.8360255116
4341878.6417124545
4448938.1633974727
4558252.661344417
4661681.799869617
4763088.5291410162
4866197.7512619982
4994376.9183873508
50107328.861374614
51109841.866183081
52161090.048119989
53229807.967157944
54335788.983949456
55376208.566570517
56596416.474463056
57784768.613751835
581178542.99842793
592453703.56788934
606043367.08905466


Parameters (Session):
par1 = ward ; par2 = ALL ; par3 = FALSE ; par4 = FALSE ;
Parameters (R input):
par1 = ward ; par2 = ALL ; par3 = FALSE ; par4 = FALSE ; par5 = ; par6 = ; par7 = ; par8 = ; par9 = ; par10 = ; par11 = ; par12 = ; par13 = ; par14 = ; par15 = ; par16 = ; par17 = ; par18 = ; par19 = ; par20 = ;
R code (references can be found in the software module):
par3 <- as.logical(par3)
par4 <- as.logical(par4)
if (par3 == 'TRUE'){
dum = xlab
xlab = ylab
ylab = dum
}
x <- t(y)
hc <- hclust(dist(x),method=par1)
d <- as.dendrogram(hc)
str(d)
mysub <- paste('Method: ',par1)
bitmap(file='test1.png')
if (par4 == 'TRUE'){
plot(d,main=main,ylab=ylab,xlab=xlab,horiz=par3, nodePar=list(pch = c(1,NA), cex=0.8, lab.cex = 0.8),type='t',center=T, sub=mysub)
} else {
plot(d,main=main,ylab=ylab,xlab=xlab,horiz=par3, nodePar=list(pch = c(1,NA), cex=0.8, lab.cex = 0.8), sub=mysub)
}
dev.off()
if (par2 != 'ALL'){
if (par3 == 'TRUE'){
ylab = 'cluster'
} else {
xlab = 'cluster'
}
par2 <- as.numeric(par2)
memb <- cutree(hc, k = par2)
cent <- NULL
for(k in 1:par2){
cent <- rbind(cent, colMeans(x[memb == k, , drop = FALSE]))
}
hc1 <- hclust(dist(cent),method=par1, members = table(memb))
de <- as.dendrogram(hc1)
bitmap(file='test2.png')
if (par4 == 'TRUE'){
plot(de,main=main,ylab=ylab,xlab=xlab,horiz=par3, nodePar=list(pch = c(1,NA), cex=0.8, lab.cex = 0.8),type='t',center=T, sub=mysub)
} else {
plot(de,main=main,ylab=ylab,xlab=xlab,horiz=par3, nodePar=list(pch = c(1,NA), cex=0.8, lab.cex = 0.8), sub=mysub)
}
dev.off()
str(de)
}
load(file='createtable')
a<-table.start()
a<-table.row.start(a)
a<-table.element(a,'Summary of Dendrogram',2,TRUE)
a<-table.row.end(a)
a<-table.row.start(a)
a<-table.element(a,'Label',header=TRUE)
a<-table.element(a,'Height',header=TRUE)
a<-table.row.end(a)
num <- length(x[,1])-1
for (i in 1:num)
{
a<-table.row.start(a)
a<-table.element(a,hc$labels[i])
a<-table.element(a,hc$height[i])
a<-table.row.end(a)
}
a<-table.end(a)
table.save(a,file='mytable1.tab')
if (par2 != 'ALL'){
a<-table.start()
a<-table.row.start(a)
a<-table.element(a,'Summary of Cut Dendrogram',2,TRUE)
a<-table.row.end(a)
a<-table.row.start(a)
a<-table.element(a,'Label',header=TRUE)
a<-table.element(a,'Height',header=TRUE)
a<-table.row.end(a)
num <- par2-1
for (i in 1:num)
{
a<-table.row.start(a)
a<-table.element(a,i)
a<-table.element(a,hc1$height[i])
a<-table.row.end(a)
}
a<-table.end(a)
table.save(a,file='mytable2.tab')
}