Free Statistics

of Irreproducible Research!

Author's title

Author*The author of this computation has been verified*
R Software Modulerwasp_hierarchicalclustering.wasp
Title produced by softwareHierarchical Clustering
Date of computationTue, 11 Nov 2008 12:14:32 -0700
Cite this page as followsStatistical Computations at FreeStatistics.org, Office for Research Development and Education, URL https://freestatistics.org/blog/index.php?v=date/2008/Nov/11/t1226431259hkqlxibcuc8me0w.htm/, Retrieved Sun, 19 May 2024 08:45:20 +0000
Statistical Computations at FreeStatistics.org, Office for Research Development and Education, URL https://freestatistics.org/blog/index.php?pk=23860, Retrieved Sun, 19 May 2024 08:45:20 +0000
QR Codes:

Original text written by user:
IsPrivate?No (this computation is public)
User-defined keywords
Estimated Impact117
Family? (F = Feedback message, R = changed R code, M = changed R Module, P = changed Parameters, D = changed Data)
F     [Trivariate Scatterplots] [Various EDA topic...] [2008-11-11 17:33:56] [cf9c64468d04c2c4dd548cc66b4e3677]
F RMPD    [Hierarchical Clustering] [Various EDA topic...] [2008-11-11 19:14:32] [e4cb5a8878d0401c2e8d19a1768b515b] [Current]
Feedback Forum
2008-11-22 17:34:54 [Kenny Simons] [reply
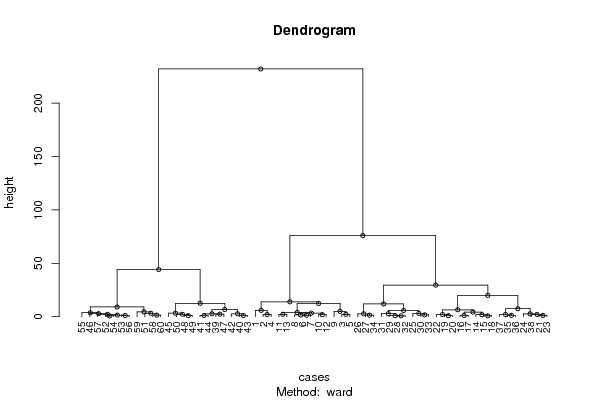
Een dendogram wordt wel eens een boomstructuur genoemd, het brengt namelijk alle gelijkaardige eigenschappen samen. Dit is een clustertechniek dat ook wel gebruikt wordt voor niet-tijdreeksen. Een goed voorbeeld hiervan is marktsegmentatie.

Zoals je op de grafiek ziet, zijn de waarden nu opgesplitst in clusters, elke cluster vertoont nu een gelijkaardigheid, dit is de meest aangewezen manier op hierarchical clustering te doen.

Post a new message
Dataseries X:
101.5	110.4	92.1
101.3	112.9	88.5
99.3	109.4	84.6
100.6	111.9	87
101.2	108.9	83.6
99.8	113.8	84.8
100.6	114.5	84.1
101.1	113.2	84.1
101.2	111	80.5
101.5	114.6	82.6
102.2	113.1	85.6
102.5	113.2	83.3
101.4	115.1	86.1
103.8	117.6	84.7
105.2	117.8	85.7
105.3	115.7	84.9
104.4	115.7	84.2
104.9	118.3	85.2
106.9	117.9	86.1
107.6	117.3	86
106.7	119.4	84.5
106.1	117.1	87.2
106.3	119	83.5
105.8	120	81.9
104.4	118.9	78.5
103.8	116	81.1
102.4	115.6	79.2
103.3	119.7	80.9
103.5	119.7	81.8
104.5	120.8	79.4
103.5	120	83.4
103.9	120.2	81.1
103.1	121.7	79.8
102.2	116.9	79.7
104.7	122.4	84
105.9	122.6	83.7
106.6	123.7	83.5
106.6	120.9	83.6
107.5	124.2	86
107.2	122.6	86.8
109	125.7	86.9
108.4	123.1	89
107	122.2	87.8
108	126.2	86.8
110.8	124.4	88.8
110.9	127.8	85.9
109.7	124.2	86.7
111	126.7	87.9
111.5	126.1	88.5
111	128.2	88.7
111.8	130.4	88.1
111.4	130.2	85.7
110.8	129.2	86.1
111.9	129.7	85.7
112.9	131	84.3
111.8	129.2	86.4
111	131.1	85.4
112.3	132.9	86.9
112.4	135.2	85.6
111.1	132.3	86.4


Summary of computational transaction
Raw Inputview raw input (R code)
Raw Outputview raw output of R engine
Computing time36 seconds
R Server'Gwilym Jenkins' @ 72.249.127.135

\begin{tabular}{lllllllll}
\hline
Summary of computational transaction \tabularnewline
Raw Input & view raw input (R code)  \tabularnewline
Raw Output & view raw output of R engine  \tabularnewline
Computing time & 36 seconds \tabularnewline
R Server & 'Gwilym Jenkins' @ 72.249.127.135 \tabularnewline
\hline
\end{tabular}
%Source: https://freestatistics.org/blog/index.php?pk=23860&T=0

[TABLE]
[ROW][C]Summary of computational transaction[/C][/ROW]
[ROW][C]Raw Input[/C][C]view raw input (R code) [/C][/ROW]
[ROW][C]Raw Output[/C][C]view raw output of R engine [/C][/ROW]
[ROW][C]Computing time[/C][C]36 seconds[/C][/ROW]
[ROW][C]R Server[/C][C]'Gwilym Jenkins' @ 72.249.127.135[/C][/ROW]
[/TABLE]
Source: https://freestatistics.org/blog/index.php?pk=23860&T=0

Globally Unique Identifier (entire table): ba.freestatistics.org/blog/index.php?pk=23860&T=0

As an alternative you can also use a QR Code:  

The GUIDs for individual cells are displayed in the table below:

Summary of computational transaction
Raw Inputview raw input (R code)
Raw Outputview raw output of R engine
Computing time36 seconds
R Server'Gwilym Jenkins' @ 72.249.127.135


Summary of Dendrogram
LabelHeight
10.707106781186548
20.76811457478686
30.806225774829859
40.927361849549567
50.978349904243247
60.984885780179612
71.04403065089106
81.09544511501033
91.12249721603218
101.14017542509913
111.14891252930761
121.25299640861417
131.27279220613579
141.40712472794704
151.43178210632764
161.45254311815147
171.56678697980096
181.71172427686237
191.82961168303490
201.85741756210067
211.93390796058137
222.03040883374266
232.0322907929321
242.0692142070437
252.17794521357138
262.20454076850487
272.21133443874960
282.25033696585204
292.30867927612304
302.62107549754218
312.66590583524444
322.6893099891605
332.70632824213286
342.80226765545423
352.80665624587371
363.06568081629505
373.16384688055847
383.26482891440574
393.32243014304053
403.66788515205633
413.95229820506904
424.24175856595941
434.53421079874847
444.95720305786675
455.80395245811841
465.87479229339253
476.4521071744103
486.6622830148285
497.42636066902864
509.05175380512833
5111.8917745401982
5212.3756862180623
5312.5013660793271
5413.8878299075531
5519.9167035461422
5629.5323075639989
5744.1688077458772
5875.9508472752781
59231.987191376794

\begin{tabular}{lllllllll}
\hline
Summary of Dendrogram \tabularnewline
Label & Height \tabularnewline
1 & 0.707106781186548 \tabularnewline
2 & 0.76811457478686 \tabularnewline
3 & 0.806225774829859 \tabularnewline
4 & 0.927361849549567 \tabularnewline
5 & 0.978349904243247 \tabularnewline
6 & 0.984885780179612 \tabularnewline
7 & 1.04403065089106 \tabularnewline
8 & 1.09544511501033 \tabularnewline
9 & 1.12249721603218 \tabularnewline
10 & 1.14017542509913 \tabularnewline
11 & 1.14891252930761 \tabularnewline
12 & 1.25299640861417 \tabularnewline
13 & 1.27279220613579 \tabularnewline
14 & 1.40712472794704 \tabularnewline
15 & 1.43178210632764 \tabularnewline
16 & 1.45254311815147 \tabularnewline
17 & 1.56678697980096 \tabularnewline
18 & 1.71172427686237 \tabularnewline
19 & 1.82961168303490 \tabularnewline
20 & 1.85741756210067 \tabularnewline
21 & 1.93390796058137 \tabularnewline
22 & 2.03040883374266 \tabularnewline
23 & 2.0322907929321 \tabularnewline
24 & 2.0692142070437 \tabularnewline
25 & 2.17794521357138 \tabularnewline
26 & 2.20454076850487 \tabularnewline
27 & 2.21133443874960 \tabularnewline
28 & 2.25033696585204 \tabularnewline
29 & 2.30867927612304 \tabularnewline
30 & 2.62107549754218 \tabularnewline
31 & 2.66590583524444 \tabularnewline
32 & 2.6893099891605 \tabularnewline
33 & 2.70632824213286 \tabularnewline
34 & 2.80226765545423 \tabularnewline
35 & 2.80665624587371 \tabularnewline
36 & 3.06568081629505 \tabularnewline
37 & 3.16384688055847 \tabularnewline
38 & 3.26482891440574 \tabularnewline
39 & 3.32243014304053 \tabularnewline
40 & 3.66788515205633 \tabularnewline
41 & 3.95229820506904 \tabularnewline
42 & 4.24175856595941 \tabularnewline
43 & 4.53421079874847 \tabularnewline
44 & 4.95720305786675 \tabularnewline
45 & 5.80395245811841 \tabularnewline
46 & 5.87479229339253 \tabularnewline
47 & 6.4521071744103 \tabularnewline
48 & 6.6622830148285 \tabularnewline
49 & 7.42636066902864 \tabularnewline
50 & 9.05175380512833 \tabularnewline
51 & 11.8917745401982 \tabularnewline
52 & 12.3756862180623 \tabularnewline
53 & 12.5013660793271 \tabularnewline
54 & 13.8878299075531 \tabularnewline
55 & 19.9167035461422 \tabularnewline
56 & 29.5323075639989 \tabularnewline
57 & 44.1688077458772 \tabularnewline
58 & 75.9508472752781 \tabularnewline
59 & 231.987191376794 \tabularnewline
\hline
\end{tabular}
%Source: https://freestatistics.org/blog/index.php?pk=23860&T=1

[TABLE]
[ROW][C]Summary of Dendrogram[/C][/ROW]
[ROW][C]Label[/C][C]Height[/C][/ROW]
[ROW][C]1[/C][C]0.707106781186548[/C][/ROW]
[ROW][C]2[/C][C]0.76811457478686[/C][/ROW]
[ROW][C]3[/C][C]0.806225774829859[/C][/ROW]
[ROW][C]4[/C][C]0.927361849549567[/C][/ROW]
[ROW][C]5[/C][C]0.978349904243247[/C][/ROW]
[ROW][C]6[/C][C]0.984885780179612[/C][/ROW]
[ROW][C]7[/C][C]1.04403065089106[/C][/ROW]
[ROW][C]8[/C][C]1.09544511501033[/C][/ROW]
[ROW][C]9[/C][C]1.12249721603218[/C][/ROW]
[ROW][C]10[/C][C]1.14017542509913[/C][/ROW]
[ROW][C]11[/C][C]1.14891252930761[/C][/ROW]
[ROW][C]12[/C][C]1.25299640861417[/C][/ROW]
[ROW][C]13[/C][C]1.27279220613579[/C][/ROW]
[ROW][C]14[/C][C]1.40712472794704[/C][/ROW]
[ROW][C]15[/C][C]1.43178210632764[/C][/ROW]
[ROW][C]16[/C][C]1.45254311815147[/C][/ROW]
[ROW][C]17[/C][C]1.56678697980096[/C][/ROW]
[ROW][C]18[/C][C]1.71172427686237[/C][/ROW]
[ROW][C]19[/C][C]1.82961168303490[/C][/ROW]
[ROW][C]20[/C][C]1.85741756210067[/C][/ROW]
[ROW][C]21[/C][C]1.93390796058137[/C][/ROW]
[ROW][C]22[/C][C]2.03040883374266[/C][/ROW]
[ROW][C]23[/C][C]2.0322907929321[/C][/ROW]
[ROW][C]24[/C][C]2.0692142070437[/C][/ROW]
[ROW][C]25[/C][C]2.17794521357138[/C][/ROW]
[ROW][C]26[/C][C]2.20454076850487[/C][/ROW]
[ROW][C]27[/C][C]2.21133443874960[/C][/ROW]
[ROW][C]28[/C][C]2.25033696585204[/C][/ROW]
[ROW][C]29[/C][C]2.30867927612304[/C][/ROW]
[ROW][C]30[/C][C]2.62107549754218[/C][/ROW]
[ROW][C]31[/C][C]2.66590583524444[/C][/ROW]
[ROW][C]32[/C][C]2.6893099891605[/C][/ROW]
[ROW][C]33[/C][C]2.70632824213286[/C][/ROW]
[ROW][C]34[/C][C]2.80226765545423[/C][/ROW]
[ROW][C]35[/C][C]2.80665624587371[/C][/ROW]
[ROW][C]36[/C][C]3.06568081629505[/C][/ROW]
[ROW][C]37[/C][C]3.16384688055847[/C][/ROW]
[ROW][C]38[/C][C]3.26482891440574[/C][/ROW]
[ROW][C]39[/C][C]3.32243014304053[/C][/ROW]
[ROW][C]40[/C][C]3.66788515205633[/C][/ROW]
[ROW][C]41[/C][C]3.95229820506904[/C][/ROW]
[ROW][C]42[/C][C]4.24175856595941[/C][/ROW]
[ROW][C]43[/C][C]4.53421079874847[/C][/ROW]
[ROW][C]44[/C][C]4.95720305786675[/C][/ROW]
[ROW][C]45[/C][C]5.80395245811841[/C][/ROW]
[ROW][C]46[/C][C]5.87479229339253[/C][/ROW]
[ROW][C]47[/C][C]6.4521071744103[/C][/ROW]
[ROW][C]48[/C][C]6.6622830148285[/C][/ROW]
[ROW][C]49[/C][C]7.42636066902864[/C][/ROW]
[ROW][C]50[/C][C]9.05175380512833[/C][/ROW]
[ROW][C]51[/C][C]11.8917745401982[/C][/ROW]
[ROW][C]52[/C][C]12.3756862180623[/C][/ROW]
[ROW][C]53[/C][C]12.5013660793271[/C][/ROW]
[ROW][C]54[/C][C]13.8878299075531[/C][/ROW]
[ROW][C]55[/C][C]19.9167035461422[/C][/ROW]
[ROW][C]56[/C][C]29.5323075639989[/C][/ROW]
[ROW][C]57[/C][C]44.1688077458772[/C][/ROW]
[ROW][C]58[/C][C]75.9508472752781[/C][/ROW]
[ROW][C]59[/C][C]231.987191376794[/C][/ROW]
[/TABLE]
Source: https://freestatistics.org/blog/index.php?pk=23860&T=1

Globally Unique Identifier (entire table): ba.freestatistics.org/blog/index.php?pk=23860&T=1

As an alternative you can also use a QR Code:  

The GUIDs for individual cells are displayed in the table below:

Summary of Dendrogram
LabelHeight
10.707106781186548
20.76811457478686
30.806225774829859
40.927361849549567
50.978349904243247
60.984885780179612
71.04403065089106
81.09544511501033
91.12249721603218
101.14017542509913
111.14891252930761
121.25299640861417
131.27279220613579
141.40712472794704
151.43178210632764
161.45254311815147
171.56678697980096
181.71172427686237
191.82961168303490
201.85741756210067
211.93390796058137
222.03040883374266
232.0322907929321
242.0692142070437
252.17794521357138
262.20454076850487
272.21133443874960
282.25033696585204
292.30867927612304
302.62107549754218
312.66590583524444
322.6893099891605
332.70632824213286
342.80226765545423
352.80665624587371
363.06568081629505
373.16384688055847
383.26482891440574
393.32243014304053
403.66788515205633
413.95229820506904
424.24175856595941
434.53421079874847
444.95720305786675
455.80395245811841
465.87479229339253
476.4521071744103
486.6622830148285
497.42636066902864
509.05175380512833
5111.8917745401982
5212.3756862180623
5312.5013660793271
5413.8878299075531
5519.9167035461422
5629.5323075639989
5744.1688077458772
5875.9508472752781
59231.987191376794


Parameters (Session):
par1 = ward ; par2 = ALL ; par3 = FALSE ; par4 = FALSE ;
Parameters (R input):
par1 = ward ; par2 = ALL ; par3 = FALSE ; par4 = FALSE ;
R code (references can be found in the software module):
par3 <- as.logical(par3)
par4 <- as.logical(par4)
if (par3 == 'TRUE'){
dum = xlab
xlab = ylab
ylab = dum
}
x <- t(y)
hc <- hclust(dist(x),method=par1)
d <- as.dendrogram(hc)
str(d)
mysub <- paste('Method: ',par1)
bitmap(file='test1.png')
if (par4 == 'TRUE'){
plot(d,main=main,ylab=ylab,xlab=xlab,horiz=par3, nodePar=list(pch = c(1,NA), cex=0.8, lab.cex = 0.8),type='t',center=T, sub=mysub)
} else {
plot(d,main=main,ylab=ylab,xlab=xlab,horiz=par3, nodePar=list(pch = c(1,NA), cex=0.8, lab.cex = 0.8), sub=mysub)
}
dev.off()
if (par2 != 'ALL'){
if (par3 == 'TRUE'){
ylab = 'cluster'
} else {
xlab = 'cluster'
}
par2 <- as.numeric(par2)
memb <- cutree(hc, k = par2)
cent <- NULL
for(k in 1:par2){
cent <- rbind(cent, colMeans(x[memb == k, , drop = FALSE]))
}
hc1 <- hclust(dist(cent),method=par1, members = table(memb))
de <- as.dendrogram(hc1)
bitmap(file='test2.png')
if (par4 == 'TRUE'){
plot(de,main=main,ylab=ylab,xlab=xlab,horiz=par3, nodePar=list(pch = c(1,NA), cex=0.8, lab.cex = 0.8),type='t',center=T, sub=mysub)
} else {
plot(de,main=main,ylab=ylab,xlab=xlab,horiz=par3, nodePar=list(pch = c(1,NA), cex=0.8, lab.cex = 0.8), sub=mysub)
}
dev.off()
str(de)
}
load(file='createtable')
a<-table.start()
a<-table.row.start(a)
a<-table.element(a,'Summary of Dendrogram',2,TRUE)
a<-table.row.end(a)
a<-table.row.start(a)
a<-table.element(a,'Label',header=TRUE)
a<-table.element(a,'Height',header=TRUE)
a<-table.row.end(a)
num <- length(x[,1])-1
for (i in 1:num)
{
a<-table.row.start(a)
a<-table.element(a,hc$labels[i])
a<-table.element(a,hc$height[i])
a<-table.row.end(a)
}
a<-table.end(a)
table.save(a,file='mytable1.tab')
if (par2 != 'ALL'){
a<-table.start()
a<-table.row.start(a)
a<-table.element(a,'Summary of Cut Dendrogram',2,TRUE)
a<-table.row.end(a)
a<-table.row.start(a)
a<-table.element(a,'Label',header=TRUE)
a<-table.element(a,'Height',header=TRUE)
a<-table.row.end(a)
num <- par2-1
for (i in 1:num)
{
a<-table.row.start(a)
a<-table.element(a,i)
a<-table.element(a,hc1$height[i])
a<-table.row.end(a)
}
a<-table.end(a)
table.save(a,file='mytable2.tab')
}