Free Statistics

of Irreproducible Research!

Author's title

Author*The author of this computation has been verified*
R Software Modulerwasp_cloud.wasp
Title produced by softwareTrivariate Scatterplots
Date of computationTue, 11 Nov 2008 10:28:14 -0700
Cite this page as followsStatistical Computations at FreeStatistics.org, Office for Research Development and Education, URL https://freestatistics.org/blog/index.php?v=date/2008/Nov/11/t12264246421ocni7xsi36dpdj.htm/, Retrieved Sun, 19 May 2024 11:34:47 +0000
Statistical Computations at FreeStatistics.org, Office for Research Development and Education, URL https://freestatistics.org/blog/index.php?pk=23757, Retrieved Sun, 19 May 2024 11:34:47 +0000
QR Codes:

Original text written by user:
IsPrivate?No (this computation is public)
User-defined keywords
Estimated Impact141
Family? (F = Feedback message, R = changed R code, M = changed R Module, P = changed Parameters, D = changed Data)
-     [Maximum-likelihood Fitting - Normal Distribution] [Workshop 2 Questi...] [2007-10-19 09:11:23] [5babdb52c730cb807dd08aeebb84155b]
F RMPD    [Trivariate Scatterplots] [] [2008-11-11 17:28:14] [a9e6d7cd6e144e8b311d9f96a24c5a25] [Current]
Feedback Forum
2008-11-19 14:13:18 [Sam De Cuyper] [reply
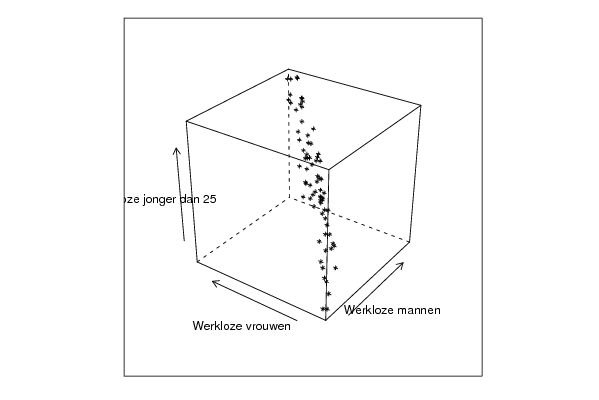
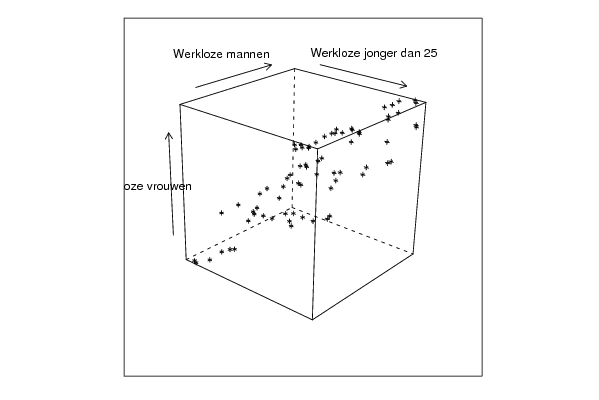
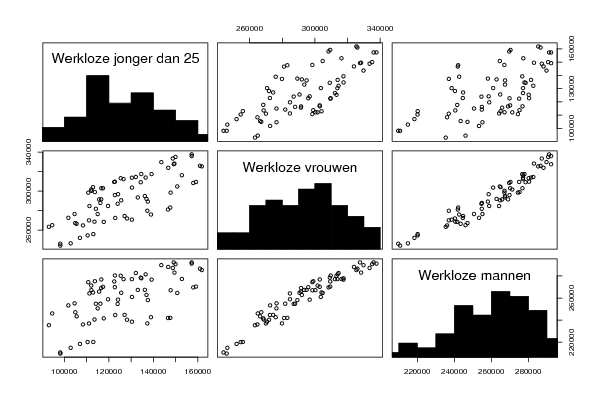
De interpretatie die gegeven is, is correct hoewel de uitleg over de matrix ontbreekt. Ook de 3D figuren zijn weggelaten. De trivariate scatterplot geeft het verband weer tussen 3 variabelen. Voor de 3D figuren geldt dat naargelang de rotatie men andere dingen zal zien. Daarom moet je de matrix raadplegen die je het verband laat zien tussen 2 variabelen. Je zal wel een vertekend beeld krijgen omdat de 3de dimensie is weggelaten. Als oplossing voor dit probleem moet je de bivariate density raadplegen.
2008-11-19 14:18:31 [Sam De Cuyper] [reply
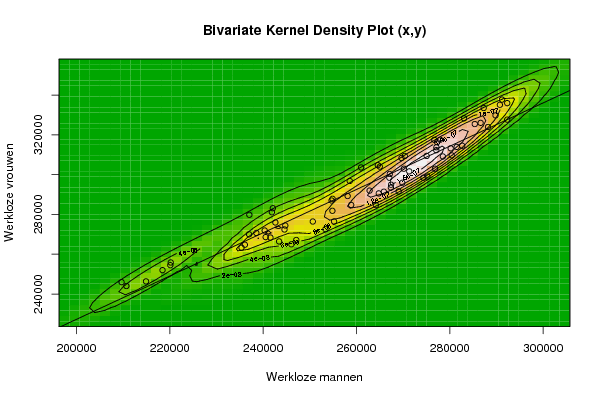
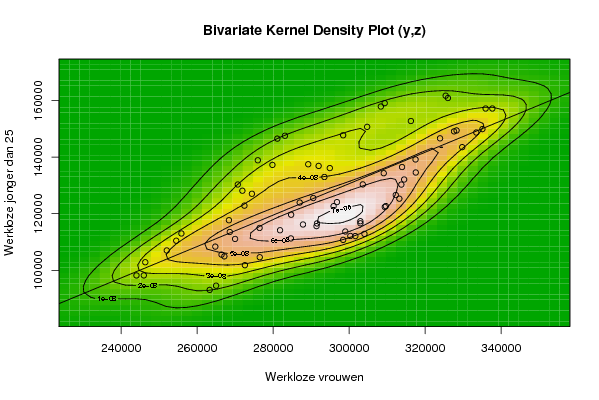
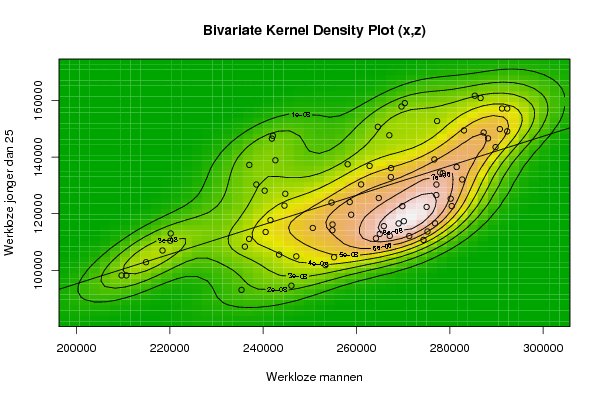
Bivariate density: De uitleg die gegeven is bij de figuren is correct hoewel de precieze omschrijving van de figuren ontbreekt. De bivariate density is een figuur waarbij de 3de dimensie onrechtstreeks wordt gesugerreerd door de hoogtelijnen. Uit de figuur kan men de concentratie en de dichtheid van de waarnemingen waarnemen. De ellipsvorm van de oppervlakte rond de rechte regressielijn wijzen op een positieve correlatie.
2008-11-24 14:14:29 [Jessica Alves Pires] [reply
Juiste berekening en goede uitleg. Er is inderdaad een positieve correlatie. Ik ben het verder eens met Sam. Ook de voordelen en nadelen van de R modules zijn goed. De student had nog kunnen zeggen dat een nadeel van deze R modules is dat ze beperkt zijn tot 3 variabelen (x,y en z).
2008-11-24 14:39:27 [Birgit Van Dyck] [reply
Van de trivariate scatterplot in 3D is niet weergegeven. Dit is de correlatie, het verband gelijktijdig nagaan tussen 3 variabelen. Door de transformatie naar 2D gaan er gegevens verloren, aangezien de 3de dimensie ontbreekt.
De bivariate density is wel weergegeven maar deze is niet precies omgeschreven, de hoogtelijnen stellen de 3de dimensie voor in verband met dichtheid en concentratie. Een ellips met een positieve helling wijst op een positieve concentratie.

Post a new message
Dataseries X:
220206
220115
218444
214912
210705
209673
237041
242081
241878
242621
238545
240337
244752
244576
241572
240541
236089
236997
264579
270349
269645
267037
258113
262813
267413
267366
264777
258863
254844
254868
277267
285351
286602
283042
276687
277915
277128
277103
275037
270150
267140
264993
287259
291186
292300
288186
281477
282656
280190
280408
276836
275216
274352
271311
289802
290726
292300
278506
269826
265861
269034
264176
255198
253353
246057
235372
258556
260993
254663
250643
243422
247105
Dataseries Y:
255843
254490
251995
246339
244019
245953
279806
283111
281097
275964
270694
271901
274412
272433
268361
268586
264768
269974
304744
309365
308347
298427
289231
291975
294912
293488
290555
284736
281818
287854
316263
325412
326011
328282
317480
317539
313737
312276
309391
302950
300316
304035
333476
337698
335932
323931
313927
314485
313218
309664
302963
298989
298423
301631
329765
335083
327616
309119
295916
291413
291542
284678
276475
272566
264981
263290
296806
303598
286994
276427
266424
267153
Dataseries Z:
113012
110452
107005
102841
98173
98181
137277
147579
146571
138920
130340
128140
127059
122860
117702
113537
108366
111078
150739
159129
157928
147768
137507
136919
136151
133001
125554
119647
114158
116193
152803
161761
160942
149470
139208
134588
130322
126611
122401
117352
112135
112879
148729
157230
157221
146681
136524
132111
125326
122716
116615
113719
110737
112093
143565
149946
149147
134339
122683
115614
116566
111272
104609
101802
94542
93051
124129
130374
123946
114971
105531
104919


Summary of computational transaction
Raw Inputview raw input (R code)
Raw Outputview raw output of R engine
Computing time3 seconds
R Server'George Udny Yule' @ 72.249.76.132

\begin{tabular}{lllllllll}
\hline
Summary of computational transaction \tabularnewline
Raw Input & view raw input (R code)  \tabularnewline
Raw Output & view raw output of R engine  \tabularnewline
Computing time & 3 seconds \tabularnewline
R Server & 'George Udny Yule' @ 72.249.76.132 \tabularnewline
\hline
\end{tabular}
%Source: https://freestatistics.org/blog/index.php?pk=23757&T=0

[TABLE]
[ROW][C]Summary of computational transaction[/C][/ROW]
[ROW][C]Raw Input[/C][C]view raw input (R code) [/C][/ROW]
[ROW][C]Raw Output[/C][C]view raw output of R engine [/C][/ROW]
[ROW][C]Computing time[/C][C]3 seconds[/C][/ROW]
[ROW][C]R Server[/C][C]'George Udny Yule' @ 72.249.76.132[/C][/ROW]
[/TABLE]
Source: https://freestatistics.org/blog/index.php?pk=23757&T=0

Globally Unique Identifier (entire table): ba.freestatistics.org/blog/index.php?pk=23757&T=0

As an alternative you can also use a QR Code:  

The GUIDs for individual cells are displayed in the table below:

Summary of computational transaction
Raw Inputview raw input (R code)
Raw Outputview raw output of R engine
Computing time3 seconds
R Server'George Udny Yule' @ 72.249.76.132


Parameters (Session):
par1 = 50 ; par2 = 50 ; par3 = Y ; par4 = Y ; par5 = Werkloze mannen ; par6 = Werkloze vrouwen ; par7 = Werkloze jonger dan 25 ;
Parameters (R input):
par1 = 50 ; par2 = 50 ; par3 = Y ; par4 = Y ; par5 = Werkloze mannen ; par6 = Werkloze vrouwen ; par7 = Werkloze jonger dan 25 ;
R code (references can be found in the software module):
x <- array(x,dim=c(length(x),1))
colnames(x) <- par5
y <- array(y,dim=c(length(y),1))
colnames(y) <- par6
z <- array(z,dim=c(length(z),1))
colnames(z) <- par7
d <- data.frame(cbind(z,y,x))
colnames(d) <- list(par7,par6,par5)
par1 <- as.numeric(par1)
par2 <- as.numeric(par2)
if (par1>500) par1 <- 500
if (par2>500) par2 <- 500
if (par1<10) par1 <- 10
if (par2<10) par2 <- 10
library(GenKern)
library(lattice)
panel.hist <- function(x, ...)
{
usr <- par('usr'); on.exit(par(usr))
par(usr = c(usr[1:2], 0, 1.5) )
h <- hist(x, plot = FALSE)
breaks <- h$breaks; nB <- length(breaks)
y <- h$counts; y <- y/max(y)
rect(breaks[-nB], 0, breaks[-1], y, col='black', ...)
}
bitmap(file='cloud1.png')
cloud(z~x*y, screen = list(x=-45, y=45, z=35),xlab=par5,ylab=par6,zlab=par7)
dev.off()
bitmap(file='cloud2.png')
cloud(z~x*y, screen = list(x=35, y=45, z=25),xlab=par5,ylab=par6,zlab=par7)
dev.off()
bitmap(file='cloud3.png')
cloud(z~x*y, screen = list(x=35, y=-25, z=90),xlab=par5,ylab=par6,zlab=par7)
dev.off()
bitmap(file='pairs.png')
pairs(d,diag.panel=panel.hist)
dev.off()
x <- as.vector(x)
y <- as.vector(y)
z <- as.vector(z)
bitmap(file='bidensity1.png')
op <- KernSur(x,y, xgridsize=par1, ygridsize=par2, correlation=cor(x,y), xbandwidth=dpik(x), ybandwidth=dpik(y))
image(op$xords, op$yords, op$zden, col=terrain.colors(100), axes=TRUE,main='Bivariate Kernel Density Plot (x,y)',xlab=par5,ylab=par6)
if (par3=='Y') contour(op$xords, op$yords, op$zden, add=TRUE)
if (par4=='Y') points(x,y)
(r<-lm(y ~ x))
abline(r)
box()
dev.off()
bitmap(file='bidensity2.png')
op <- KernSur(y,z, xgridsize=par1, ygridsize=par2, correlation=cor(y,z), xbandwidth=dpik(y), ybandwidth=dpik(z))
op
image(op$xords, op$yords, op$zden, col=terrain.colors(100), axes=TRUE,main='Bivariate Kernel Density Plot (y,z)',xlab=par6,ylab=par7)
if (par3=='Y') contour(op$xords, op$yords, op$zden, add=TRUE)
if (par4=='Y') points(y,z)
(r<-lm(z ~ y))
abline(r)
box()
dev.off()
bitmap(file='bidensity3.png')
op <- KernSur(x,z, xgridsize=par1, ygridsize=par2, correlation=cor(x,z), xbandwidth=dpik(x), ybandwidth=dpik(z))
op
image(op$xords, op$yords, op$zden, col=terrain.colors(100), axes=TRUE,main='Bivariate Kernel Density Plot (x,z)',xlab=par5,ylab=par7)
if (par3=='Y') contour(op$xords, op$yords, op$zden, add=TRUE)
if (par4=='Y') points(x,z)
(r<-lm(z ~ x))
abline(r)
box()
dev.off()