Free Statistics

of Irreproducible Research!

Author's title

Author*The author of this computation has been verified*
R Software Modulerwasp_hierarchicalclustering.wasp
Title produced by softwareHierarchical Clustering
Date of computationTue, 11 Nov 2008 09:52:48 -0700
Cite this page as followsStatistical Computations at FreeStatistics.org, Office for Research Development and Education, URL https://freestatistics.org/blog/index.php?v=date/2008/Nov/11/t1226424045nbziehvf1ch0b2l.htm/, Retrieved Sun, 19 May 2024 08:49:49 +0000
Statistical Computations at FreeStatistics.org, Office for Research Development and Education, URL https://freestatistics.org/blog/index.php?pk=23748, Retrieved Sun, 19 May 2024 08:49:49 +0000
QR Codes:

Original text written by user:
IsPrivate?No (this computation is public)
User-defined keywordsdendogram
Estimated Impact115
Family? (F = Feedback message, R = changed R code, M = changed R Module, P = changed Parameters, D = changed Data)
F       [Hierarchical Clustering] [Dendogram] [2008-11-11 16:52:48] [0cdfeda4aa2f9e551c2e529c44a404df] [Current]
F   PD    [Hierarchical Clustering] [task 8 dendogram] [2008-11-12 19:48:41] [1eab65e90adf64584b8e6f0da23ff414]
Feedback Forum
2008-12-05 16:56:59 [a2386b643d711541400692649981f2dc] [reply
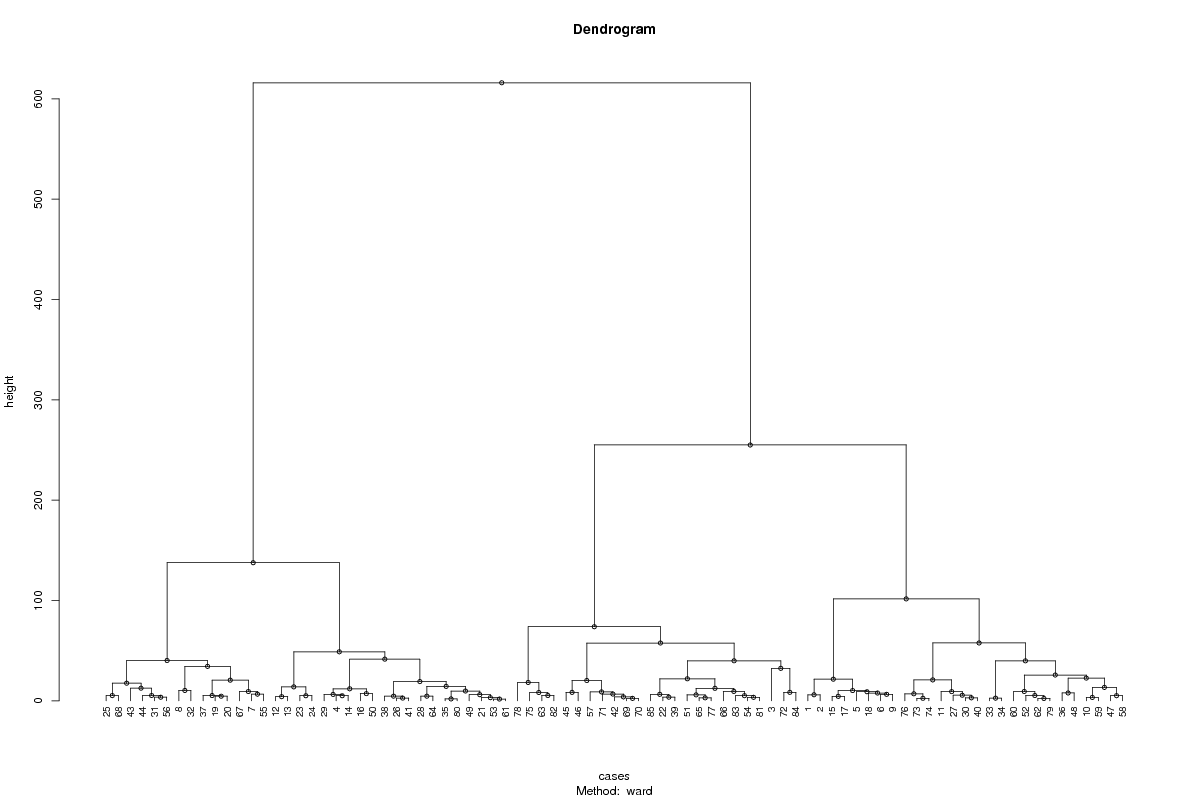
Goede uitleg maar je kon specifieker zijn. Bij een dendogram splitsen we een tijdreeks op in 2 delen, alle periodes onder tak 1 zijn gelijkaardig en alle periodes onder tak 2 zijn gelijkaardig. Elke cluster wordt dan verder opnieuw onderverdeelt.

Post a new message
Dataseries X:
103.1	119.5	98.6
100.6	125	98
103.1	145	106.8
95.5	105.3	96.6
90.5	116.9	100.1
90.9	120.1	107.7
88.8	88.9	91.5
90.7	78.4	97.8
94.3	114.6	107.4
104.6	113.3	117.5
111.1	117	105.6
110.8	99.6	97.4
107.2	99.4	99.5
99	101.9	98
99	115.2	104.3
91	108.5	100.6
96.2	113.8	101.1
96.9	121	103.9
96.2	92.2	96.9
100.1	90.2	95.5
99	101.5	108.4
115.4	126.6	117
106.9	93.9	103.8
107.1	89.8	100.8
99.3	93.4	110.6
99.2	101.5	104
108.3	110.4	112.6
105.6	105.9	107.3
99.5	108.4	98.9
107.4	113.9	109.8
93.1	86.1	104.9
88.1	69.4	102.2
110.7	101.2	123.9
113.1	100.5	124.9
99.6	98	112.7
93.6	106.6	121.9
98.6	90.1	100.6
99.6	96.9	104.3
114.3	125.9	120.4
107.8	112	107.5
101.2	100	102.9
112.5	123.9	125.6
100.5	79.8	107.5
93.9	83.4	108.8
116.2	113.6	128.4
112	112.9	121.1
106.4	104	119.5
95.7	109.9	128.7
96	99	108.7
95.8	106.3	105.5
103	128.9	119.8
102.2	111.1	111.3
98.4	102.9	110.6
111.4	130	120.1
86.6	87	97.5
91.3	87.5	107.7
107.9	117.6	127.3
101.8	103.4	117.2
104.4	110.8	119.8
93.4	112.6	116.2
100.1	102.5	111
98.5	112.4	112.4
112.9	135.6	130.6
101.4	105.1	109.1
107.1	127.7	118.8
110.8	137	123.9
90.3	91	101.6
95.5	90.5	112.8
111.4	122.4	128
113	123.3	129.6
107.5	124.3	125.8
95.9	120	119.5
106.3	118.1	115.7
105.2	119	113.6
117.2	142.7	129.7
106.9	123.6	112
108.2	129.6	116.8
113	151.6	127
97.2	110.4	112.1
99.9	99.2	114.2
108.1	130.5	121.1
118.1	136.2	131.6
109.1	129.7	125
93.3	128	120.4
112.1	121.6	117.7


Summary of computational transaction
Raw Inputview raw input (R code)
Raw Outputview raw output of R engine
Computing time1 seconds
R Server'George Udny Yule' @ 72.249.76.132

\begin{tabular}{lllllllll}
\hline
Summary of computational transaction \tabularnewline
Raw Input & view raw input (R code)  \tabularnewline
Raw Output & view raw output of R engine  \tabularnewline
Computing time & 1 seconds \tabularnewline
R Server & 'George Udny Yule' @ 72.249.76.132 \tabularnewline
\hline
\end{tabular}
%Source: https://freestatistics.org/blog/index.php?pk=23748&T=0

[TABLE]
[ROW][C]Summary of computational transaction[/C][/ROW]
[ROW][C]Raw Input[/C][C]view raw input (R code) [/C][/ROW]
[ROW][C]Raw Output[/C][C]view raw output of R engine [/C][/ROW]
[ROW][C]Computing time[/C][C]1 seconds[/C][/ROW]
[ROW][C]R Server[/C][C]'George Udny Yule' @ 72.249.76.132[/C][/ROW]
[/TABLE]
Source: https://freestatistics.org/blog/index.php?pk=23748&T=0

Globally Unique Identifier (entire table): ba.freestatistics.org/blog/index.php?pk=23748&T=0

As an alternative you can also use a QR Code:  

The GUIDs for individual cells are displayed in the table below:

Summary of computational transaction
Raw Inputview raw input (R code)
Raw Outputview raw output of R engine
Computing time1 seconds
R Server'George Udny Yule' @ 72.249.76.132


Summary of Dendrogram
LabelHeight
11.79164728671688
21.94422220952236
32.40416305603426
42.43515913237717
52.5357444666212
62.69258240356725
72.73130005674953
82.96984848098350
93.00998338865848
103.18332654337857
113.40293990543471
123.48425027803688
133.61109401705356
143.64142829120663
153.92960166560812
164.17252920900500
174.47660585711988
184.60108682813093
194.63896540189727
204.68028887864762
215.07641605859882
225.08428952755447
235.17783738639985
245.18933631913884
255.26212884676915
265.26738699859055
275.32183467367931
285.32187317710463
295.32916503778968
305.62339086568237
315.96437549847263
326.07124369466421
336.12392684889938
346.40106811205645
356.4730209330729
366.49626901819971
376.66708332031332
386.7305861047332
397.03096028947898
407.2034713853808
417.77762001581431
427.84474346298207
438.3441422839075
448.45103543951865
458.45990543682375
468.91282493757552
479.0867036557393
489.19331638346833
499.27335972236975
509.34549572797372
519.40063722643411
529.79667038748257
5310.2488603058311
5410.3498792263485
5511.9902287284447
5612.4898785629431
5712.6110661241587
5813.3754496791211
5913.9241413931233
6014.4192247863398
6117.6001879620435
6218.3153198251480
6319.2045102568841
6420.2376117476367
6520.6177715981540
6620.8835491866826
6721.5927902639461
6821.9593143455042
6922.6759899936794
7025.7177986653815
7132.3967966714272
7234.342037223887
7339.8461728989036
7439.9073325362165
7540.208117885738
7641.5627535049924
7748.8665720256781
7857.6350857590425
7957.6936691576887
8073.8682858990825
81101.607398879592
82137.661108739049
83255.003958732451
84616.033846497955

\begin{tabular}{lllllllll}
\hline
Summary of Dendrogram \tabularnewline
Label & Height \tabularnewline
1 & 1.79164728671688 \tabularnewline
2 & 1.94422220952236 \tabularnewline
3 & 2.40416305603426 \tabularnewline
4 & 2.43515913237717 \tabularnewline
5 & 2.5357444666212 \tabularnewline
6 & 2.69258240356725 \tabularnewline
7 & 2.73130005674953 \tabularnewline
8 & 2.96984848098350 \tabularnewline
9 & 3.00998338865848 \tabularnewline
10 & 3.18332654337857 \tabularnewline
11 & 3.40293990543471 \tabularnewline
12 & 3.48425027803688 \tabularnewline
13 & 3.61109401705356 \tabularnewline
14 & 3.64142829120663 \tabularnewline
15 & 3.92960166560812 \tabularnewline
16 & 4.17252920900500 \tabularnewline
17 & 4.47660585711988 \tabularnewline
18 & 4.60108682813093 \tabularnewline
19 & 4.63896540189727 \tabularnewline
20 & 4.68028887864762 \tabularnewline
21 & 5.07641605859882 \tabularnewline
22 & 5.08428952755447 \tabularnewline
23 & 5.17783738639985 \tabularnewline
24 & 5.18933631913884 \tabularnewline
25 & 5.26212884676915 \tabularnewline
26 & 5.26738699859055 \tabularnewline
27 & 5.32183467367931 \tabularnewline
28 & 5.32187317710463 \tabularnewline
29 & 5.32916503778968 \tabularnewline
30 & 5.62339086568237 \tabularnewline
31 & 5.96437549847263 \tabularnewline
32 & 6.07124369466421 \tabularnewline
33 & 6.12392684889938 \tabularnewline
34 & 6.40106811205645 \tabularnewline
35 & 6.4730209330729 \tabularnewline
36 & 6.49626901819971 \tabularnewline
37 & 6.66708332031332 \tabularnewline
38 & 6.7305861047332 \tabularnewline
39 & 7.03096028947898 \tabularnewline
40 & 7.2034713853808 \tabularnewline
41 & 7.77762001581431 \tabularnewline
42 & 7.84474346298207 \tabularnewline
43 & 8.3441422839075 \tabularnewline
44 & 8.45103543951865 \tabularnewline
45 & 8.45990543682375 \tabularnewline
46 & 8.91282493757552 \tabularnewline
47 & 9.0867036557393 \tabularnewline
48 & 9.19331638346833 \tabularnewline
49 & 9.27335972236975 \tabularnewline
50 & 9.34549572797372 \tabularnewline
51 & 9.40063722643411 \tabularnewline
52 & 9.79667038748257 \tabularnewline
53 & 10.2488603058311 \tabularnewline
54 & 10.3498792263485 \tabularnewline
55 & 11.9902287284447 \tabularnewline
56 & 12.4898785629431 \tabularnewline
57 & 12.6110661241587 \tabularnewline
58 & 13.3754496791211 \tabularnewline
59 & 13.9241413931233 \tabularnewline
60 & 14.4192247863398 \tabularnewline
61 & 17.6001879620435 \tabularnewline
62 & 18.3153198251480 \tabularnewline
63 & 19.2045102568841 \tabularnewline
64 & 20.2376117476367 \tabularnewline
65 & 20.6177715981540 \tabularnewline
66 & 20.8835491866826 \tabularnewline
67 & 21.5927902639461 \tabularnewline
68 & 21.9593143455042 \tabularnewline
69 & 22.6759899936794 \tabularnewline
70 & 25.7177986653815 \tabularnewline
71 & 32.3967966714272 \tabularnewline
72 & 34.342037223887 \tabularnewline
73 & 39.8461728989036 \tabularnewline
74 & 39.9073325362165 \tabularnewline
75 & 40.208117885738 \tabularnewline
76 & 41.5627535049924 \tabularnewline
77 & 48.8665720256781 \tabularnewline
78 & 57.6350857590425 \tabularnewline
79 & 57.6936691576887 \tabularnewline
80 & 73.8682858990825 \tabularnewline
81 & 101.607398879592 \tabularnewline
82 & 137.661108739049 \tabularnewline
83 & 255.003958732451 \tabularnewline
84 & 616.033846497955 \tabularnewline
\hline
\end{tabular}
%Source: https://freestatistics.org/blog/index.php?pk=23748&T=1

[TABLE]
[ROW][C]Summary of Dendrogram[/C][/ROW]
[ROW][C]Label[/C][C]Height[/C][/ROW]
[ROW][C]1[/C][C]1.79164728671688[/C][/ROW]
[ROW][C]2[/C][C]1.94422220952236[/C][/ROW]
[ROW][C]3[/C][C]2.40416305603426[/C][/ROW]
[ROW][C]4[/C][C]2.43515913237717[/C][/ROW]
[ROW][C]5[/C][C]2.5357444666212[/C][/ROW]
[ROW][C]6[/C][C]2.69258240356725[/C][/ROW]
[ROW][C]7[/C][C]2.73130005674953[/C][/ROW]
[ROW][C]8[/C][C]2.96984848098350[/C][/ROW]
[ROW][C]9[/C][C]3.00998338865848[/C][/ROW]
[ROW][C]10[/C][C]3.18332654337857[/C][/ROW]
[ROW][C]11[/C][C]3.40293990543471[/C][/ROW]
[ROW][C]12[/C][C]3.48425027803688[/C][/ROW]
[ROW][C]13[/C][C]3.61109401705356[/C][/ROW]
[ROW][C]14[/C][C]3.64142829120663[/C][/ROW]
[ROW][C]15[/C][C]3.92960166560812[/C][/ROW]
[ROW][C]16[/C][C]4.17252920900500[/C][/ROW]
[ROW][C]17[/C][C]4.47660585711988[/C][/ROW]
[ROW][C]18[/C][C]4.60108682813093[/C][/ROW]
[ROW][C]19[/C][C]4.63896540189727[/C][/ROW]
[ROW][C]20[/C][C]4.68028887864762[/C][/ROW]
[ROW][C]21[/C][C]5.07641605859882[/C][/ROW]
[ROW][C]22[/C][C]5.08428952755447[/C][/ROW]
[ROW][C]23[/C][C]5.17783738639985[/C][/ROW]
[ROW][C]24[/C][C]5.18933631913884[/C][/ROW]
[ROW][C]25[/C][C]5.26212884676915[/C][/ROW]
[ROW][C]26[/C][C]5.26738699859055[/C][/ROW]
[ROW][C]27[/C][C]5.32183467367931[/C][/ROW]
[ROW][C]28[/C][C]5.32187317710463[/C][/ROW]
[ROW][C]29[/C][C]5.32916503778968[/C][/ROW]
[ROW][C]30[/C][C]5.62339086568237[/C][/ROW]
[ROW][C]31[/C][C]5.96437549847263[/C][/ROW]
[ROW][C]32[/C][C]6.07124369466421[/C][/ROW]
[ROW][C]33[/C][C]6.12392684889938[/C][/ROW]
[ROW][C]34[/C][C]6.40106811205645[/C][/ROW]
[ROW][C]35[/C][C]6.4730209330729[/C][/ROW]
[ROW][C]36[/C][C]6.49626901819971[/C][/ROW]
[ROW][C]37[/C][C]6.66708332031332[/C][/ROW]
[ROW][C]38[/C][C]6.7305861047332[/C][/ROW]
[ROW][C]39[/C][C]7.03096028947898[/C][/ROW]
[ROW][C]40[/C][C]7.2034713853808[/C][/ROW]
[ROW][C]41[/C][C]7.77762001581431[/C][/ROW]
[ROW][C]42[/C][C]7.84474346298207[/C][/ROW]
[ROW][C]43[/C][C]8.3441422839075[/C][/ROW]
[ROW][C]44[/C][C]8.45103543951865[/C][/ROW]
[ROW][C]45[/C][C]8.45990543682375[/C][/ROW]
[ROW][C]46[/C][C]8.91282493757552[/C][/ROW]
[ROW][C]47[/C][C]9.0867036557393[/C][/ROW]
[ROW][C]48[/C][C]9.19331638346833[/C][/ROW]
[ROW][C]49[/C][C]9.27335972236975[/C][/ROW]
[ROW][C]50[/C][C]9.34549572797372[/C][/ROW]
[ROW][C]51[/C][C]9.40063722643411[/C][/ROW]
[ROW][C]52[/C][C]9.79667038748257[/C][/ROW]
[ROW][C]53[/C][C]10.2488603058311[/C][/ROW]
[ROW][C]54[/C][C]10.3498792263485[/C][/ROW]
[ROW][C]55[/C][C]11.9902287284447[/C][/ROW]
[ROW][C]56[/C][C]12.4898785629431[/C][/ROW]
[ROW][C]57[/C][C]12.6110661241587[/C][/ROW]
[ROW][C]58[/C][C]13.3754496791211[/C][/ROW]
[ROW][C]59[/C][C]13.9241413931233[/C][/ROW]
[ROW][C]60[/C][C]14.4192247863398[/C][/ROW]
[ROW][C]61[/C][C]17.6001879620435[/C][/ROW]
[ROW][C]62[/C][C]18.3153198251480[/C][/ROW]
[ROW][C]63[/C][C]19.2045102568841[/C][/ROW]
[ROW][C]64[/C][C]20.2376117476367[/C][/ROW]
[ROW][C]65[/C][C]20.6177715981540[/C][/ROW]
[ROW][C]66[/C][C]20.8835491866826[/C][/ROW]
[ROW][C]67[/C][C]21.5927902639461[/C][/ROW]
[ROW][C]68[/C][C]21.9593143455042[/C][/ROW]
[ROW][C]69[/C][C]22.6759899936794[/C][/ROW]
[ROW][C]70[/C][C]25.7177986653815[/C][/ROW]
[ROW][C]71[/C][C]32.3967966714272[/C][/ROW]
[ROW][C]72[/C][C]34.342037223887[/C][/ROW]
[ROW][C]73[/C][C]39.8461728989036[/C][/ROW]
[ROW][C]74[/C][C]39.9073325362165[/C][/ROW]
[ROW][C]75[/C][C]40.208117885738[/C][/ROW]
[ROW][C]76[/C][C]41.5627535049924[/C][/ROW]
[ROW][C]77[/C][C]48.8665720256781[/C][/ROW]
[ROW][C]78[/C][C]57.6350857590425[/C][/ROW]
[ROW][C]79[/C][C]57.6936691576887[/C][/ROW]
[ROW][C]80[/C][C]73.8682858990825[/C][/ROW]
[ROW][C]81[/C][C]101.607398879592[/C][/ROW]
[ROW][C]82[/C][C]137.661108739049[/C][/ROW]
[ROW][C]83[/C][C]255.003958732451[/C][/ROW]
[ROW][C]84[/C][C]616.033846497955[/C][/ROW]
[/TABLE]
Source: https://freestatistics.org/blog/index.php?pk=23748&T=1

Globally Unique Identifier (entire table): ba.freestatistics.org/blog/index.php?pk=23748&T=1

As an alternative you can also use a QR Code:  

The GUIDs for individual cells are displayed in the table below:

Summary of Dendrogram
LabelHeight
11.79164728671688
21.94422220952236
32.40416305603426
42.43515913237717
52.5357444666212
62.69258240356725
72.73130005674953
82.96984848098350
93.00998338865848
103.18332654337857
113.40293990543471
123.48425027803688
133.61109401705356
143.64142829120663
153.92960166560812
164.17252920900500
174.47660585711988
184.60108682813093
194.63896540189727
204.68028887864762
215.07641605859882
225.08428952755447
235.17783738639985
245.18933631913884
255.26212884676915
265.26738699859055
275.32183467367931
285.32187317710463
295.32916503778968
305.62339086568237
315.96437549847263
326.07124369466421
336.12392684889938
346.40106811205645
356.4730209330729
366.49626901819971
376.66708332031332
386.7305861047332
397.03096028947898
407.2034713853808
417.77762001581431
427.84474346298207
438.3441422839075
448.45103543951865
458.45990543682375
468.91282493757552
479.0867036557393
489.19331638346833
499.27335972236975
509.34549572797372
519.40063722643411
529.79667038748257
5310.2488603058311
5410.3498792263485
5511.9902287284447
5612.4898785629431
5712.6110661241587
5813.3754496791211
5913.9241413931233
6014.4192247863398
6117.6001879620435
6218.3153198251480
6319.2045102568841
6420.2376117476367
6520.6177715981540
6620.8835491866826
6721.5927902639461
6821.9593143455042
6922.6759899936794
7025.7177986653815
7132.3967966714272
7234.342037223887
7339.8461728989036
7439.9073325362165
7540.208117885738
7641.5627535049924
7748.8665720256781
7857.6350857590425
7957.6936691576887
8073.8682858990825
81101.607398879592
82137.661108739049
83255.003958732451
84616.033846497955


Parameters (Session):
par1 = ward ; par2 = ALL ; par3 = FALSE ; par4 = FALSE ;
Parameters (R input):
par1 = ward ; par2 = ALL ; par3 = FALSE ; par4 = FALSE ;
R code (references can be found in the software module):
par3 <- as.logical(par3)
par4 <- as.logical(par4)
if (par3 == 'TRUE'){
dum = xlab
xlab = ylab
ylab = dum
}
x <- t(y)
hc <- hclust(dist(x),method=par1)
d <- as.dendrogram(hc)
str(d)
mysub <- paste('Method: ',par1)
bitmap(file='test1.png')
if (par4 == 'TRUE'){
plot(d,main=main,ylab=ylab,xlab=xlab,horiz=par3, nodePar=list(pch = c(1,NA), cex=0.8, lab.cex = 0.8),type='t',center=T, sub=mysub)
} else {
plot(d,main=main,ylab=ylab,xlab=xlab,horiz=par3, nodePar=list(pch = c(1,NA), cex=0.8, lab.cex = 0.8), sub=mysub)
}
dev.off()
if (par2 != 'ALL'){
if (par3 == 'TRUE'){
ylab = 'cluster'
} else {
xlab = 'cluster'
}
par2 <- as.numeric(par2)
memb <- cutree(hc, k = par2)
cent <- NULL
for(k in 1:par2){
cent <- rbind(cent, colMeans(x[memb == k, , drop = FALSE]))
}
hc1 <- hclust(dist(cent),method=par1, members = table(memb))
de <- as.dendrogram(hc1)
bitmap(file='test2.png')
if (par4 == 'TRUE'){
plot(de,main=main,ylab=ylab,xlab=xlab,horiz=par3, nodePar=list(pch = c(1,NA), cex=0.8, lab.cex = 0.8),type='t',center=T, sub=mysub)
} else {
plot(de,main=main,ylab=ylab,xlab=xlab,horiz=par3, nodePar=list(pch = c(1,NA), cex=0.8, lab.cex = 0.8), sub=mysub)
}
dev.off()
str(de)
}
load(file='createtable')
a<-table.start()
a<-table.row.start(a)
a<-table.element(a,'Summary of Dendrogram',2,TRUE)
a<-table.row.end(a)
a<-table.row.start(a)
a<-table.element(a,'Label',header=TRUE)
a<-table.element(a,'Height',header=TRUE)
a<-table.row.end(a)
num <- length(x[,1])-1
for (i in 1:num)
{
a<-table.row.start(a)
a<-table.element(a,hc$labels[i])
a<-table.element(a,hc$height[i])
a<-table.row.end(a)
}
a<-table.end(a)
table.save(a,file='mytable1.tab')
if (par2 != 'ALL'){
a<-table.start()
a<-table.row.start(a)
a<-table.element(a,'Summary of Cut Dendrogram',2,TRUE)
a<-table.row.end(a)
a<-table.row.start(a)
a<-table.element(a,'Label',header=TRUE)
a<-table.element(a,'Height',header=TRUE)
a<-table.row.end(a)
num <- par2-1
for (i in 1:num)
{
a<-table.row.start(a)
a<-table.element(a,i)
a<-table.element(a,hc1$height[i])
a<-table.row.end(a)
}
a<-table.end(a)
table.save(a,file='mytable2.tab')
}