Free Statistics

of Irreproducible Research!

Author's title

Author*The author of this computation has been verified*
R Software Modulerwasp_boxcoxlin.wasp
Title produced by softwareBox-Cox Linearity Plot
Date of computationTue, 11 Nov 2008 09:29:33 -0700
Cite this page as followsStatistical Computations at FreeStatistics.org, Office for Research Development and Education, URL https://freestatistics.org/blog/index.php?v=date/2008/Nov/11/t12264210301x4rsgvvwsad2f1.htm/, Retrieved Sun, 19 May 2024 11:09:55 +0000
Statistical Computations at FreeStatistics.org, Office for Research Development and Education, URL https://freestatistics.org/blog/index.php?pk=23683, Retrieved Sun, 19 May 2024 11:09:55 +0000
QR Codes:

Original text written by user:
IsPrivate?No (this computation is public)
User-defined keywords
Estimated Impact121
Family? (F = Feedback message, R = changed R code, M = changed R Module, P = changed Parameters, D = changed Data)
F       [Box-Cox Linearity Plot] [Q3] [2008-11-11 16:29:33] [7ed4ec9f8cdf7df79ef87b9dc09dff20] [Current]
Feedback Forum
2008-11-20 16:56:49 [Steffi Van Isveldt] [reply
Je tijdreeks werd niet correct ingevoerd volgens mij.
2008-11-22 14:59:24 [Stijn Loomans] [reply
Weeral geen correcte tijdreeksen , dus weinig van te evalueren.
2008-11-23 13:35:16 [Joris Deboel] [reply
Geen correcte gegevens.
2008-11-24 11:25:49 [Lindsay Heyndrickx] [reply
Hier is met foute tijdreeksen gewerkt.
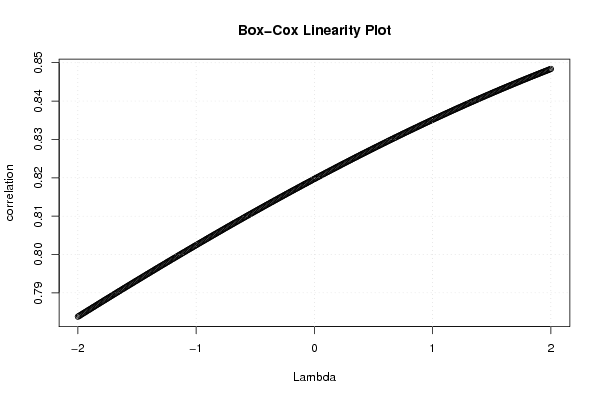
Hier werd geen uitleg bij gegeven. Deze plot wordt gebruikt om tijdreeksen aan te passen. Hier krijg je een lamda parameter zodanig dat je alle transformaties van -2 tot 2 krijgt. Je kan hier de correlatie berekenen van x en y en zo kan je kijken welke het grootst is of het meest lineair.

Post a new message
Dataseries X:
88.6
71.6
93.3
84.3
80.6
75.2
69.7
82
69.4
83.3
79.6
82.6
80.6
83.5
76.3
Dataseries Y:
20
16
19.8
18.4
17.1
15.5
14.7
17.1
15.4
16.2
15
17.2
16
17
14.4


Summary of computational transaction
Raw Inputview raw input (R code)
Raw Outputview raw output of R engine
Computing time2 seconds
R Server'Gwilym Jenkins' @ 72.249.127.135

\begin{tabular}{lllllllll}
\hline
Summary of computational transaction \tabularnewline
Raw Input & view raw input (R code)  \tabularnewline
Raw Output & view raw output of R engine  \tabularnewline
Computing time & 2 seconds \tabularnewline
R Server & 'Gwilym Jenkins' @ 72.249.127.135 \tabularnewline
\hline
\end{tabular}
%Source: https://freestatistics.org/blog/index.php?pk=23683&T=0

[TABLE]
[ROW][C]Summary of computational transaction[/C][/ROW]
[ROW][C]Raw Input[/C][C]view raw input (R code) [/C][/ROW]
[ROW][C]Raw Output[/C][C]view raw output of R engine [/C][/ROW]
[ROW][C]Computing time[/C][C]2 seconds[/C][/ROW]
[ROW][C]R Server[/C][C]'Gwilym Jenkins' @ 72.249.127.135[/C][/ROW]
[/TABLE]
Source: https://freestatistics.org/blog/index.php?pk=23683&T=0

Globally Unique Identifier (entire table): ba.freestatistics.org/blog/index.php?pk=23683&T=0

As an alternative you can also use a QR Code:  

The GUIDs for individual cells are displayed in the table below:

Summary of computational transaction
Raw Inputview raw input (R code)
Raw Outputview raw output of R engine
Computing time2 seconds
R Server'Gwilym Jenkins' @ 72.249.127.135


Box-Cox Linearity Plot
# observations x15
maximum correlation0.848376278701644
optimal lambda(x)2
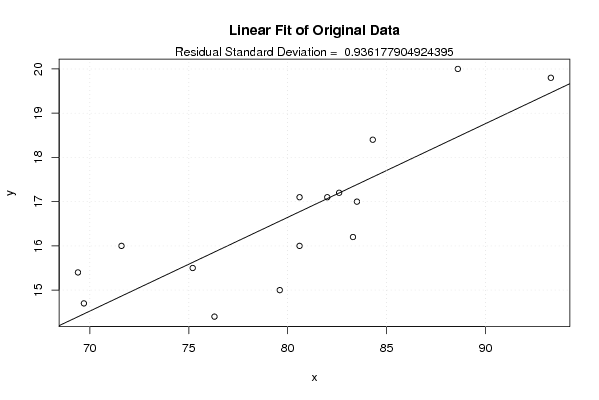
Residual SD (orginial)0.936177904924395
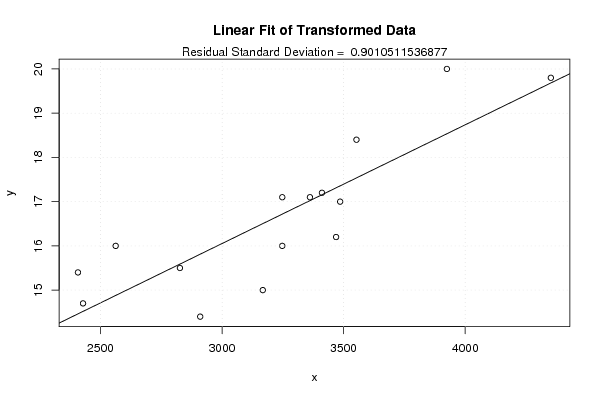
Residual SD (transformed)0.9010511536877

\begin{tabular}{lllllllll}
\hline
Box-Cox Linearity Plot \tabularnewline
# observations x & 15 \tabularnewline
maximum correlation & 0.848376278701644 \tabularnewline
optimal lambda(x) & 2 \tabularnewline
Residual SD (orginial) & 0.936177904924395 \tabularnewline
Residual SD (transformed) & 0.9010511536877 \tabularnewline
\hline
\end{tabular}
%Source: https://freestatistics.org/blog/index.php?pk=23683&T=1

[TABLE]
[ROW][C]Box-Cox Linearity Plot[/C][/ROW]
[ROW][C]# observations x[/C][C]15[/C][/ROW]
[ROW][C]maximum correlation[/C][C]0.848376278701644[/C][/ROW]
[ROW][C]optimal lambda(x)[/C][C]2[/C][/ROW]
[ROW][C]Residual SD (orginial)[/C][C]0.936177904924395[/C][/ROW]
[ROW][C]Residual SD (transformed)[/C][C]0.9010511536877[/C][/ROW]
[/TABLE]
Source: https://freestatistics.org/blog/index.php?pk=23683&T=1

Globally Unique Identifier (entire table): ba.freestatistics.org/blog/index.php?pk=23683&T=1

As an alternative you can also use a QR Code:  

The GUIDs for individual cells are displayed in the table below:

Box-Cox Linearity Plot
# observations x15
maximum correlation0.848376278701644
optimal lambda(x)2
Residual SD (orginial)0.936177904924395
Residual SD (transformed)0.9010511536877


Parameters (Session):
Parameters (R input):
R code (references can be found in the software module):
n <- length(x)
c <- array(NA,dim=c(401))
l <- array(NA,dim=c(401))
mx <- 0
mxli <- -999
for (i in 1:401)
{
l[i] <- (i-201)/100
if (l[i] != 0)
{
x1 <- (x^l[i] - 1) / l[i]
} else {
x1 <- log(x)
}
c[i] <- cor(x1,y)
if (mx < abs(c[i]))
{
mx <- abs(c[i])
mxli <- l[i]
}
}
c
mx
mxli
if (mxli != 0)
{
x1 <- (x^mxli - 1) / mxli
} else {
x1 <- log(x)
}
r<-lm(y~x)
se <- sqrt(var(r$residuals))
r1 <- lm(y~x1)
se1 <- sqrt(var(r1$residuals))
bitmap(file='test1.png')
plot(l,c,main='Box-Cox Linearity Plot',xlab='Lambda',ylab='correlation')
grid()
dev.off()
bitmap(file='test2.png')
plot(x,y,main='Linear Fit of Original Data',xlab='x',ylab='y')
abline(r)
grid()
mtext(paste('Residual Standard Deviation = ',se))
dev.off()
bitmap(file='test3.png')
plot(x1,y,main='Linear Fit of Transformed Data',xlab='x',ylab='y')
abline(r1)
grid()
mtext(paste('Residual Standard Deviation = ',se1))
dev.off()
load(file='createtable')
a<-table.start()
a<-table.row.start(a)
a<-table.element(a,'Box-Cox Linearity Plot',2,TRUE)
a<-table.row.end(a)
a<-table.row.start(a)
a<-table.element(a,'# observations x',header=TRUE)
a<-table.element(a,n)
a<-table.row.end(a)
a<-table.row.start(a)
a<-table.element(a,'maximum correlation',header=TRUE)
a<-table.element(a,mx)
a<-table.row.end(a)
a<-table.row.start(a)
a<-table.element(a,'optimal lambda(x)',header=TRUE)
a<-table.element(a,mxli)
a<-table.row.end(a)
a<-table.row.start(a)
a<-table.element(a,'Residual SD (orginial)',header=TRUE)
a<-table.element(a,se)
a<-table.row.end(a)
a<-table.row.start(a)
a<-table.element(a,'Residual SD (transformed)',header=TRUE)
a<-table.element(a,se1)
a<-table.row.end(a)
a<-table.end(a)
table.save(a,file='mytable.tab')