Free Statistics

of Irreproducible Research!

Author's title

Author*Unverified author*
R Software Modulerwasp_bidensity.wasp
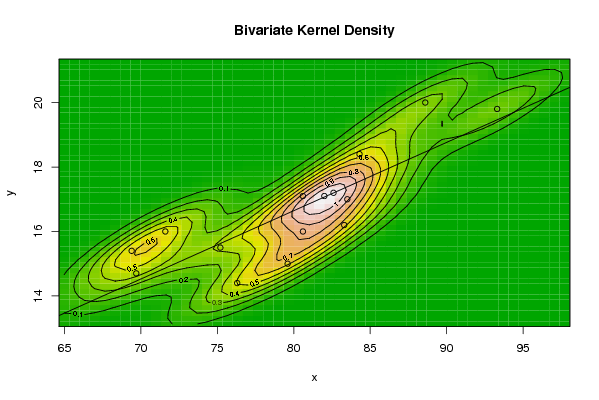
Title produced by softwareBivariate Kernel Density Estimation
Date of computationTue, 11 Nov 2008 09:14:42 -0700
Cite this page as followsStatistical Computations at FreeStatistics.org, Office for Research Development and Education, URL https://freestatistics.org/blog/index.php?v=date/2008/Nov/11/t1226420174xxefjpax16l2ea2.htm/, Retrieved Sun, 19 May 2024 11:36:45 +0000
Statistical Computations at FreeStatistics.org, Office for Research Development and Education, URL https://freestatistics.org/blog/index.php?pk=23650, Retrieved Sun, 19 May 2024 11:36:45 +0000
QR Codes:

Original text written by user:
IsPrivate?No (this computation is public)
User-defined keywords
Estimated Impact115
Family? (F = Feedback message, R = changed R code, M = changed R Module, P = changed Parameters, D = changed Data)
F       [Bivariate Kernel Density Estimation] [Q1] [2008-11-11 16:14:42] [ee28d11f695cd3bc1f8bbd77ba77987a] [Current]
Feedback Forum
2008-11-22 09:49:21 [Astrid Sniekers] [reply

De student heeft zijn/haar tijdreeksen niet in het document geplaatst. Hierdoor weet ik niet welke datasets hij/zij hier vergelijkt. Ook zegt de student dit niet in zijn/haar document. Er zijn geen conclusies getrokken. De student zal aan de hand van de oplossingen die in de les zijn gegeven, de oefening opnieuw moeten maken.

Ook zijn de tijdreeksen die de student gebruikt niet correct. Een tijdreeks moet minstens 60 maandelijkse observaties bevatten. Hij of zij gebruikt veel te weinig observaties.

Q2:

De student heeft geen poging gedaan om een oplossing te formuleren. De vraag is onbeantwoord gebleven.

Post a new message
Dataseries X:
88.6
71.6
93.3
84.3
80.6
75.2
69.7
82
69.4
83.3
79.6
82.6
80.6
83.5
76.3
Dataseries Y:
20
16
19.8
18.4
17.1
15.5
14.7
17.1
15.4
16.2
15
17.2
16
17
14.4


Summary of computational transaction
Raw Inputview raw input (R code)
Raw Outputview raw output of R engine
Computing time3 seconds
R Server'Herman Ole Andreas Wold' @ 193.190.124.10:1001

\begin{tabular}{lllllllll}
\hline
Summary of computational transaction \tabularnewline
Raw Input & view raw input (R code)  \tabularnewline
Raw Output & view raw output of R engine  \tabularnewline
Computing time & 3 seconds \tabularnewline
R Server & 'Herman Ole Andreas Wold' @ 193.190.124.10:1001 \tabularnewline
\hline
\end{tabular}
%Source: https://freestatistics.org/blog/index.php?pk=23650&T=0

[TABLE]
[ROW][C]Summary of computational transaction[/C][/ROW]
[ROW][C]Raw Input[/C][C]view raw input (R code) [/C][/ROW]
[ROW][C]Raw Output[/C][C]view raw output of R engine [/C][/ROW]
[ROW][C]Computing time[/C][C]3 seconds[/C][/ROW]
[ROW][C]R Server[/C][C]'Herman Ole Andreas Wold' @ 193.190.124.10:1001[/C][/ROW]
[/TABLE]
Source: https://freestatistics.org/blog/index.php?pk=23650&T=0

Globally Unique Identifier (entire table): ba.freestatistics.org/blog/index.php?pk=23650&T=0

As an alternative you can also use a QR Code:  

The GUIDs for individual cells are displayed in the table below:

Summary of computational transaction
Raw Inputview raw input (R code)
Raw Outputview raw output of R engine
Computing time3 seconds
R Server'Herman Ole Andreas Wold' @ 193.190.124.10:1001


Bandwidth
x axis2.94405258805187
y axis0.844180110906567
Correlation
correlation used in KDE0.835143786782374
correlation(x,y)0.835143786782374

\begin{tabular}{lllllllll}
\hline
Bandwidth \tabularnewline
x axis & 2.94405258805187 \tabularnewline
y axis & 0.844180110906567 \tabularnewline
Correlation \tabularnewline
correlation used in KDE & 0.835143786782374 \tabularnewline
correlation(x,y) & 0.835143786782374 \tabularnewline
\hline
\end{tabular}
%Source: https://freestatistics.org/blog/index.php?pk=23650&T=1

[TABLE]
[ROW][C]Bandwidth[/C][/ROW]
[ROW][C]x axis[/C][C]2.94405258805187[/C][/ROW]
[ROW][C]y axis[/C][C]0.844180110906567[/C][/ROW]
[ROW][C]Correlation[/C][/ROW]
[ROW][C]correlation used in KDE[/C][C]0.835143786782374[/C][/ROW]
[ROW][C]correlation(x,y)[/C][C]0.835143786782374[/C][/ROW]
[/TABLE]
Source: https://freestatistics.org/blog/index.php?pk=23650&T=1

Globally Unique Identifier (entire table): ba.freestatistics.org/blog/index.php?pk=23650&T=1

As an alternative you can also use a QR Code:  

The GUIDs for individual cells are displayed in the table below:

Bandwidth
x axis2.94405258805187
y axis0.844180110906567
Correlation
correlation used in KDE0.835143786782374
correlation(x,y)0.835143786782374


Parameters (Session):
par1 = 50 ; par2 = 50 ; par3 = 0 ; par4 = 0 ; par5 = 0 ; par6 = Y ; par7 = Y ;
Parameters (R input):
par1 = 50 ; par2 = 50 ; par3 = 0 ; par4 = 0 ; par5 = 0 ; par6 = Y ; par7 = Y ;
R code (references can be found in the software module):
par1 <- as(par1,'numeric')
par2 <- as(par2,'numeric')
par3 <- as(par3,'numeric')
par4 <- as(par4,'numeric')
par5 <- as(par5,'numeric')
library('GenKern')
if (par3==0) par3 <- dpik(x)
if (par4==0) par4 <- dpik(y)
if (par5==0) par5 <- cor(x,y)
if (par1 > 500) par1 <- 500
if (par2 > 500) par2 <- 500
bitmap(file='bidensity.png')
op <- KernSur(x,y, xgridsize=par1, ygridsize=par2, correlation=par5, xbandwidth=par3, ybandwidth=par4)
image(op$xords, op$yords, op$zden, col=terrain.colors(100), axes=TRUE,main=main,xlab=xlab,ylab=ylab)
if (par6=='Y') contour(op$xords, op$yords, op$zden, add=TRUE)
if (par7=='Y') points(x,y)
(r<-lm(y ~ x))
abline(r)
box()
dev.off()
load(file='createtable')
a<-table.start()
a<-table.row.start(a)
a<-table.element(a,'Bandwidth',2,TRUE)
a<-table.row.end(a)
a<-table.row.start(a)
a<-table.element(a,'x axis',header=TRUE)
a<-table.element(a,par3)
a<-table.row.end(a)
a<-table.row.start(a)
a<-table.element(a,'y axis',header=TRUE)
a<-table.element(a,par4)
a<-table.row.end(a)
a<-table.row.start(a)
a<-table.element(a,'Correlation',2,TRUE)
a<-table.row.end(a)
a<-table.row.start(a)
a<-table.element(a,'correlation used in KDE',header=TRUE)
a<-table.element(a,par5)
a<-table.row.end(a)
a<-table.row.start(a)
a<-table.element(a,'correlation(x,y)',header=TRUE)
a<-table.element(a,cor(x,y))
a<-table.row.end(a)
a<-table.end(a)
table.save(a,file='mytable.tab')