Free Statistics

of Irreproducible Research!

Author's title

Author*The author of this computation has been verified*
R Software Modulerwasp_hierarchicalclustering.wasp
Title produced by softwareHierarchical Clustering
Date of computationTue, 11 Nov 2008 09:08:25 -0700
Cite this page as followsStatistical Computations at FreeStatistics.org, Office for Research Development and Education, URL https://freestatistics.org/blog/index.php?v=date/2008/Nov/11/t1226419853c2v1uh4cw7xpjea.htm/, Retrieved Sun, 19 May 2024 11:34:26 +0000
Statistical Computations at FreeStatistics.org, Office for Research Development and Education, URL https://freestatistics.org/blog/index.php?pk=23641, Retrieved Sun, 19 May 2024 11:34:26 +0000
QR Codes:

Original text written by user:
IsPrivate?No (this computation is public)
User-defined keywords
Estimated Impact111
Family? (F = Feedback message, R = changed R code, M = changed R Module, P = changed Parameters, D = changed Data)
-       [Hierarchical Clustering] [Various EDA topic...] [2008-11-11 16:08:25] [a9e6d7cd6e144e8b311d9f96a24c5a25] [Current]
Feedback Forum

Post a new message
Dataseries X:
10030	17471	46737
9536	14968	44737
9953	15449	47557
9775	17582	51261
9843	18501	55457
9461	17291	56659
9230	16465	58609
8956	17109	59382
9608	18438	61773
9482	16944	63957
9962	16362	68596
9766	16965	72177
10312	18937	75406
10032	17842	76166
10411	16187	79315
10438	17655	81498
10803	19194	83580
10365	18400	84371
10488	17436	87196
9698	19526	88097
10087	21304	89233
9769	18947	89191
10381	18786	91690
10117	24304	91379
10775	23724	93150
10735	23823	93809
11601	21433	95112
10749	23900	92812
11227	25432	91524
10904	23619	89082
11418	23761	89984
10429	23844	87307
10755	26374	87683
9566	24406	87339
6849	24752	94868
7210	26005	97006
8472	27758	97832
9334	25534	97888
9523	26415	107411
9622	28217	115751
10215	29101	118399
10752	27715	119545
11766	27622	125345
11816	29065	129831
12730	31450	132645
13481	29571	132924
14905	30996	140225
14571	30937	143589
15308	34106	146909
15870	32851	145038
15950	36114	148559
16350	34383	152418
17086	38077	153209
17668	35638	149805
17947	35254	150299
18322	36683	144756
18696	38977	144677
18772	34951	140757
18947	34177	141650
19142	35299	142721
19724	36419	140737


Summary of computational transaction
Raw Inputview raw input (R code)
Raw Outputview raw output of R engine
Computing time2 seconds
R Server'George Udny Yule' @ 72.249.76.132

\begin{tabular}{lllllllll}
\hline
Summary of computational transaction \tabularnewline
Raw Input & view raw input (R code)  \tabularnewline
Raw Output & view raw output of R engine  \tabularnewline
Computing time & 2 seconds \tabularnewline
R Server & 'George Udny Yule' @ 72.249.76.132 \tabularnewline
\hline
\end{tabular}
%Source: https://freestatistics.org/blog/index.php?pk=23641&T=0

[TABLE]
[ROW][C]Summary of computational transaction[/C][/ROW]
[ROW][C]Raw Input[/C][C]view raw input (R code) [/C][/ROW]
[ROW][C]Raw Output[/C][C]view raw output of R engine [/C][/ROW]
[ROW][C]Computing time[/C][C]2 seconds[/C][/ROW]
[ROW][C]R Server[/C][C]'George Udny Yule' @ 72.249.76.132[/C][/ROW]
[/TABLE]
Source: https://freestatistics.org/blog/index.php?pk=23641&T=0

Globally Unique Identifier (entire table): ba.freestatistics.org/blog/index.php?pk=23641&T=0

As an alternative you can also use a QR Code:  

The GUIDs for individual cells are displayed in the table below:

Summary of computational transaction
Raw Inputview raw input (R code)
Raw Outputview raw output of R engine
Computing time2 seconds
R Server'George Udny Yule' @ 72.249.76.132


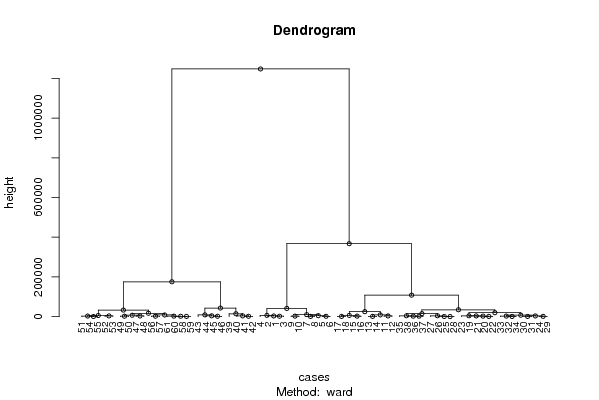
Summary of Dendrogram
LabelHeight
1381.963349027102
2685.078827581177
3984.45300756894
41030.35770487729
51042.75644327906
61047.83777370354
71194.63383511434
81203.31251136187
91239.80562992753
101361.99302494543
111589.18501125577
121747.80662545946
131876.88065683463
141996.41139417579
152042.66566035658
162183.30323134465
172312.55897222103
182321.96253199745
192325.62959217499
202384.77889459779
212524.06640394062
222602.87131068334
232630.82534578029
242649.10701935577
252925.45518438226
263078.18407034937
273360.71610336212
283381.05501286211
293604.04649999277
303636.69987763632
313740.80859651593
323848.76772486987
333937.27458753022
344218.59312937512
354296.63386953788
364333.37517020345
374389.74735884419
385087.60034505388
395694.05178249901
406250.94947429363
416535.37853754534
427152.84199664938
437241.98876426081
448403.77277062499
458946.14232287838
468959.79275179331
4710295.3641863892
4814611.9006392637
4915135.1250153876
5017028.593739249
5119912.6814372188
5225063.7363629172
5332974.7532542658
5434760.3689674837
5541436.2510944457
5643240.5333768405
57108357.992610779
58175570.598185376
59367277.458317044
601247153.48002657

\begin{tabular}{lllllllll}
\hline
Summary of Dendrogram \tabularnewline
Label & Height \tabularnewline
1 & 381.963349027102 \tabularnewline
2 & 685.078827581177 \tabularnewline
3 & 984.45300756894 \tabularnewline
4 & 1030.35770487729 \tabularnewline
5 & 1042.75644327906 \tabularnewline
6 & 1047.83777370354 \tabularnewline
7 & 1194.63383511434 \tabularnewline
8 & 1203.31251136187 \tabularnewline
9 & 1239.80562992753 \tabularnewline
10 & 1361.99302494543 \tabularnewline
11 & 1589.18501125577 \tabularnewline
12 & 1747.80662545946 \tabularnewline
13 & 1876.88065683463 \tabularnewline
14 & 1996.41139417579 \tabularnewline
15 & 2042.66566035658 \tabularnewline
16 & 2183.30323134465 \tabularnewline
17 & 2312.55897222103 \tabularnewline
18 & 2321.96253199745 \tabularnewline
19 & 2325.62959217499 \tabularnewline
20 & 2384.77889459779 \tabularnewline
21 & 2524.06640394062 \tabularnewline
22 & 2602.87131068334 \tabularnewline
23 & 2630.82534578029 \tabularnewline
24 & 2649.10701935577 \tabularnewline
25 & 2925.45518438226 \tabularnewline
26 & 3078.18407034937 \tabularnewline
27 & 3360.71610336212 \tabularnewline
28 & 3381.05501286211 \tabularnewline
29 & 3604.04649999277 \tabularnewline
30 & 3636.69987763632 \tabularnewline
31 & 3740.80859651593 \tabularnewline
32 & 3848.76772486987 \tabularnewline
33 & 3937.27458753022 \tabularnewline
34 & 4218.59312937512 \tabularnewline
35 & 4296.63386953788 \tabularnewline
36 & 4333.37517020345 \tabularnewline
37 & 4389.74735884419 \tabularnewline
38 & 5087.60034505388 \tabularnewline
39 & 5694.05178249901 \tabularnewline
40 & 6250.94947429363 \tabularnewline
41 & 6535.37853754534 \tabularnewline
42 & 7152.84199664938 \tabularnewline
43 & 7241.98876426081 \tabularnewline
44 & 8403.77277062499 \tabularnewline
45 & 8946.14232287838 \tabularnewline
46 & 8959.79275179331 \tabularnewline
47 & 10295.3641863892 \tabularnewline
48 & 14611.9006392637 \tabularnewline
49 & 15135.1250153876 \tabularnewline
50 & 17028.593739249 \tabularnewline
51 & 19912.6814372188 \tabularnewline
52 & 25063.7363629172 \tabularnewline
53 & 32974.7532542658 \tabularnewline
54 & 34760.3689674837 \tabularnewline
55 & 41436.2510944457 \tabularnewline
56 & 43240.5333768405 \tabularnewline
57 & 108357.992610779 \tabularnewline
58 & 175570.598185376 \tabularnewline
59 & 367277.458317044 \tabularnewline
60 & 1247153.48002657 \tabularnewline
\hline
\end{tabular}
%Source: https://freestatistics.org/blog/index.php?pk=23641&T=1

[TABLE]
[ROW][C]Summary of Dendrogram[/C][/ROW]
[ROW][C]Label[/C][C]Height[/C][/ROW]
[ROW][C]1[/C][C]381.963349027102[/C][/ROW]
[ROW][C]2[/C][C]685.078827581177[/C][/ROW]
[ROW][C]3[/C][C]984.45300756894[/C][/ROW]
[ROW][C]4[/C][C]1030.35770487729[/C][/ROW]
[ROW][C]5[/C][C]1042.75644327906[/C][/ROW]
[ROW][C]6[/C][C]1047.83777370354[/C][/ROW]
[ROW][C]7[/C][C]1194.63383511434[/C][/ROW]
[ROW][C]8[/C][C]1203.31251136187[/C][/ROW]
[ROW][C]9[/C][C]1239.80562992753[/C][/ROW]
[ROW][C]10[/C][C]1361.99302494543[/C][/ROW]
[ROW][C]11[/C][C]1589.18501125577[/C][/ROW]
[ROW][C]12[/C][C]1747.80662545946[/C][/ROW]
[ROW][C]13[/C][C]1876.88065683463[/C][/ROW]
[ROW][C]14[/C][C]1996.41139417579[/C][/ROW]
[ROW][C]15[/C][C]2042.66566035658[/C][/ROW]
[ROW][C]16[/C][C]2183.30323134465[/C][/ROW]
[ROW][C]17[/C][C]2312.55897222103[/C][/ROW]
[ROW][C]18[/C][C]2321.96253199745[/C][/ROW]
[ROW][C]19[/C][C]2325.62959217499[/C][/ROW]
[ROW][C]20[/C][C]2384.77889459779[/C][/ROW]
[ROW][C]21[/C][C]2524.06640394062[/C][/ROW]
[ROW][C]22[/C][C]2602.87131068334[/C][/ROW]
[ROW][C]23[/C][C]2630.82534578029[/C][/ROW]
[ROW][C]24[/C][C]2649.10701935577[/C][/ROW]
[ROW][C]25[/C][C]2925.45518438226[/C][/ROW]
[ROW][C]26[/C][C]3078.18407034937[/C][/ROW]
[ROW][C]27[/C][C]3360.71610336212[/C][/ROW]
[ROW][C]28[/C][C]3381.05501286211[/C][/ROW]
[ROW][C]29[/C][C]3604.04649999277[/C][/ROW]
[ROW][C]30[/C][C]3636.69987763632[/C][/ROW]
[ROW][C]31[/C][C]3740.80859651593[/C][/ROW]
[ROW][C]32[/C][C]3848.76772486987[/C][/ROW]
[ROW][C]33[/C][C]3937.27458753022[/C][/ROW]
[ROW][C]34[/C][C]4218.59312937512[/C][/ROW]
[ROW][C]35[/C][C]4296.63386953788[/C][/ROW]
[ROW][C]36[/C][C]4333.37517020345[/C][/ROW]
[ROW][C]37[/C][C]4389.74735884419[/C][/ROW]
[ROW][C]38[/C][C]5087.60034505388[/C][/ROW]
[ROW][C]39[/C][C]5694.05178249901[/C][/ROW]
[ROW][C]40[/C][C]6250.94947429363[/C][/ROW]
[ROW][C]41[/C][C]6535.37853754534[/C][/ROW]
[ROW][C]42[/C][C]7152.84199664938[/C][/ROW]
[ROW][C]43[/C][C]7241.98876426081[/C][/ROW]
[ROW][C]44[/C][C]8403.77277062499[/C][/ROW]
[ROW][C]45[/C][C]8946.14232287838[/C][/ROW]
[ROW][C]46[/C][C]8959.79275179331[/C][/ROW]
[ROW][C]47[/C][C]10295.3641863892[/C][/ROW]
[ROW][C]48[/C][C]14611.9006392637[/C][/ROW]
[ROW][C]49[/C][C]15135.1250153876[/C][/ROW]
[ROW][C]50[/C][C]17028.593739249[/C][/ROW]
[ROW][C]51[/C][C]19912.6814372188[/C][/ROW]
[ROW][C]52[/C][C]25063.7363629172[/C][/ROW]
[ROW][C]53[/C][C]32974.7532542658[/C][/ROW]
[ROW][C]54[/C][C]34760.3689674837[/C][/ROW]
[ROW][C]55[/C][C]41436.2510944457[/C][/ROW]
[ROW][C]56[/C][C]43240.5333768405[/C][/ROW]
[ROW][C]57[/C][C]108357.992610779[/C][/ROW]
[ROW][C]58[/C][C]175570.598185376[/C][/ROW]
[ROW][C]59[/C][C]367277.458317044[/C][/ROW]
[ROW][C]60[/C][C]1247153.48002657[/C][/ROW]
[/TABLE]
Source: https://freestatistics.org/blog/index.php?pk=23641&T=1

Globally Unique Identifier (entire table): ba.freestatistics.org/blog/index.php?pk=23641&T=1

As an alternative you can also use a QR Code:  

The GUIDs for individual cells are displayed in the table below:

Summary of Dendrogram
LabelHeight
1381.963349027102
2685.078827581177
3984.45300756894
41030.35770487729
51042.75644327906
61047.83777370354
71194.63383511434
81203.31251136187
91239.80562992753
101361.99302494543
111589.18501125577
121747.80662545946
131876.88065683463
141996.41139417579
152042.66566035658
162183.30323134465
172312.55897222103
182321.96253199745
192325.62959217499
202384.77889459779
212524.06640394062
222602.87131068334
232630.82534578029
242649.10701935577
252925.45518438226
263078.18407034937
273360.71610336212
283381.05501286211
293604.04649999277
303636.69987763632
313740.80859651593
323848.76772486987
333937.27458753022
344218.59312937512
354296.63386953788
364333.37517020345
374389.74735884419
385087.60034505388
395694.05178249901
406250.94947429363
416535.37853754534
427152.84199664938
437241.98876426081
448403.77277062499
458946.14232287838
468959.79275179331
4710295.3641863892
4814611.9006392637
4915135.1250153876
5017028.593739249
5119912.6814372188
5225063.7363629172
5332974.7532542658
5434760.3689674837
5541436.2510944457
5643240.5333768405
57108357.992610779
58175570.598185376
59367277.458317044
601247153.48002657


Parameters (Session):
par1 = ward ; par2 = ALL ; par3 = FALSE ; par4 = FALSE ;
Parameters (R input):
par1 = ward ; par2 = ALL ; par3 = FALSE ; par4 = FALSE ;
R code (references can be found in the software module):
par3 <- as.logical(par3)
par4 <- as.logical(par4)
if (par3 == 'TRUE'){
dum = xlab
xlab = ylab
ylab = dum
}
x <- t(y)
hc <- hclust(dist(x),method=par1)
d <- as.dendrogram(hc)
str(d)
mysub <- paste('Method: ',par1)
bitmap(file='test1.png')
if (par4 == 'TRUE'){
plot(d,main=main,ylab=ylab,xlab=xlab,horiz=par3, nodePar=list(pch = c(1,NA), cex=0.8, lab.cex = 0.8),type='t',center=T, sub=mysub)
} else {
plot(d,main=main,ylab=ylab,xlab=xlab,horiz=par3, nodePar=list(pch = c(1,NA), cex=0.8, lab.cex = 0.8), sub=mysub)
}
dev.off()
if (par2 != 'ALL'){
if (par3 == 'TRUE'){
ylab = 'cluster'
} else {
xlab = 'cluster'
}
par2 <- as.numeric(par2)
memb <- cutree(hc, k = par2)
cent <- NULL
for(k in 1:par2){
cent <- rbind(cent, colMeans(x[memb == k, , drop = FALSE]))
}
hc1 <- hclust(dist(cent),method=par1, members = table(memb))
de <- as.dendrogram(hc1)
bitmap(file='test2.png')
if (par4 == 'TRUE'){
plot(de,main=main,ylab=ylab,xlab=xlab,horiz=par3, nodePar=list(pch = c(1,NA), cex=0.8, lab.cex = 0.8),type='t',center=T, sub=mysub)
} else {
plot(de,main=main,ylab=ylab,xlab=xlab,horiz=par3, nodePar=list(pch = c(1,NA), cex=0.8, lab.cex = 0.8), sub=mysub)
}
dev.off()
str(de)
}
load(file='createtable')
a<-table.start()
a<-table.row.start(a)
a<-table.element(a,'Summary of Dendrogram',2,TRUE)
a<-table.row.end(a)
a<-table.row.start(a)
a<-table.element(a,'Label',header=TRUE)
a<-table.element(a,'Height',header=TRUE)
a<-table.row.end(a)
num <- length(x[,1])-1
for (i in 1:num)
{
a<-table.row.start(a)
a<-table.element(a,hc$labels[i])
a<-table.element(a,hc$height[i])
a<-table.row.end(a)
}
a<-table.end(a)
table.save(a,file='mytable1.tab')
if (par2 != 'ALL'){
a<-table.start()
a<-table.row.start(a)
a<-table.element(a,'Summary of Cut Dendrogram',2,TRUE)
a<-table.row.end(a)
a<-table.row.start(a)
a<-table.element(a,'Label',header=TRUE)
a<-table.element(a,'Height',header=TRUE)
a<-table.row.end(a)
num <- par2-1
for (i in 1:num)
{
a<-table.row.start(a)
a<-table.element(a,i)
a<-table.element(a,hc1$height[i])
a<-table.row.end(a)
}
a<-table.end(a)
table.save(a,file='mytable2.tab')
}