Free Statistics

of Irreproducible Research!

Author's title

Author*The author of this computation has been verified*
R Software Modulerwasp_cloud.wasp
Title produced by softwareTrivariate Scatterplots
Date of computationTue, 11 Nov 2008 08:14:26 -0700
Cite this page as followsStatistical Computations at FreeStatistics.org, Office for Research Development and Education, URL https://freestatistics.org/blog/index.php?v=date/2008/Nov/11/t1226416774wri0vcdbuhvfa8t.htm/, Retrieved Sun, 19 May 2024 09:19:29 +0000
Statistical Computations at FreeStatistics.org, Office for Research Development and Education, URL https://freestatistics.org/blog/index.php?pk=23587, Retrieved Sun, 19 May 2024 09:19:29 +0000
QR Codes:

Original text written by user:
IsPrivate?No (this computation is public)
User-defined keywordsgdm
Estimated Impact144
Family? (F = Feedback message, R = changed R code, M = changed R Module, P = changed Parameters, D = changed Data)
F       [Trivariate Scatterplots] [WS3 Task 1 - Triv...] [2008-11-11 15:14:26] [99f79d508deef838ee89a56fb32f134e] [Current]
Feedback Forum
2008-11-18 09:22:27 [Evelyn Gabriel] [reply
De student heeft blijkbaar de Trivariate Scatterplots buiten beschouwing gelaten. Nochtans vind ik dit de beste methode om een duidelijk overzicht te krijgen over de verbanden tussen de variabelen. Het voordeel is dat je 3 variabelen met elkaar kan vergelijken en dat ook onmiddellijk de Bivariate Kernel Density Plot wordt weergegeven.
2008-11-20 10:14:27 [Angelique Van de Vijver] [reply
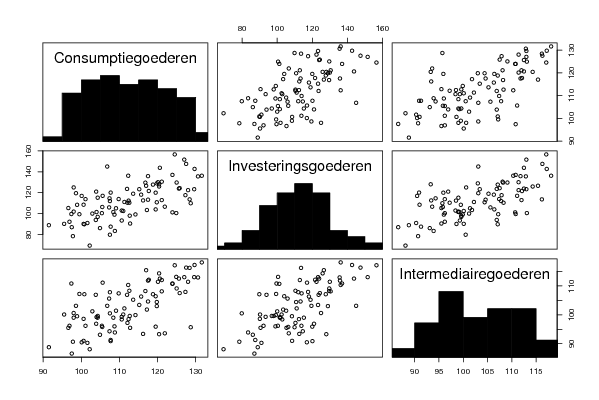
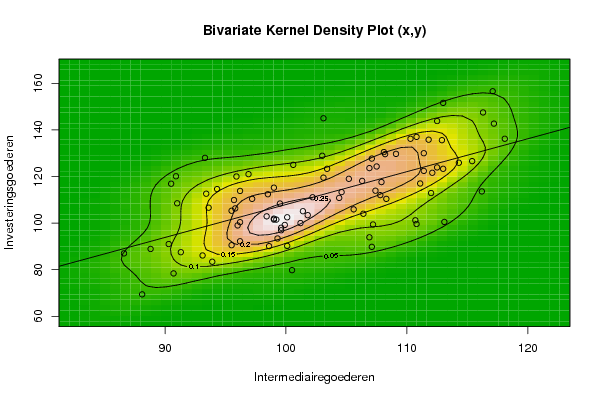
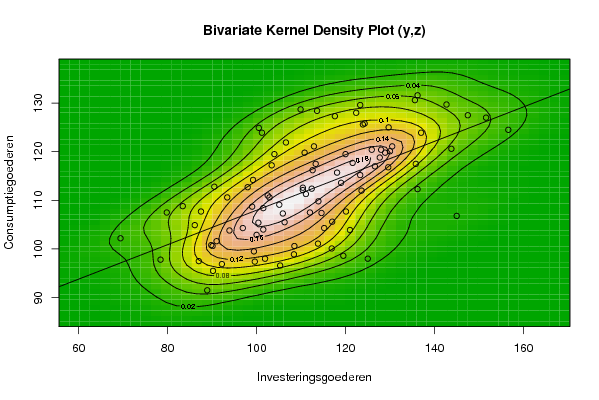
Er is inderdaad een min of meer positieve correlatie tussen de verschillende variabelen. Dit zie je aan de bivariate kernel density plots, waar de hoogtelijnen een ellips vormen die naar rechtsboven is gericht en die rond de diagonaal ligt.
Er is wel een verschil tussen de gewone correlaties en de partiële correlaties (zie tabel) wat erop wijst dat de correlatie wordt beïnvloed door een 3e variabele.
Met deze bivariate kernel density plots kan je dus de correlatie van 2 variabelen voorstellen. Via deze methode kan die correlatie wel beïnvloed zijn door een 3e variabele waardoor je misschien een vertekend beeld krijgt en een schijncorrelatie. De partiële correlatie lost dit probleem op: deze werkt eerst de effecten van deze 3e variabele weg en berekent dan de correlatie tussen de 2 variabelen.
Foute conclusie van de student: Niet de partiële correlatie van x en y is 0.64 maar wel de gewone correlatie(zie tabel).
De correlatiewaarden zijn echter redelijk laag waardoor er niet echt sprake is van een sterke correlatie, zeker als men kijkt naar de partiële correlatie zijn deze waarden zeer laag (rond de 0.40). Hierbij kan men dus niet echt spreken van een verband tussen de variabelen.
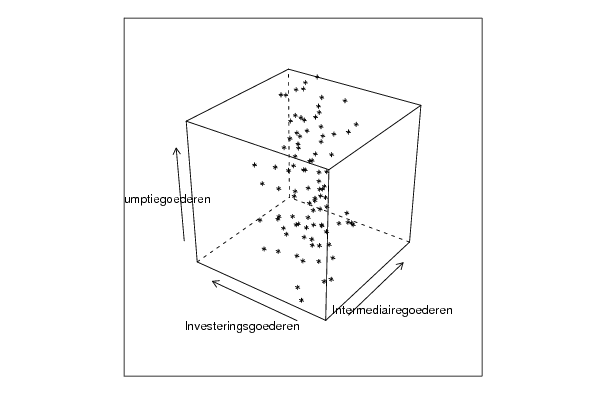
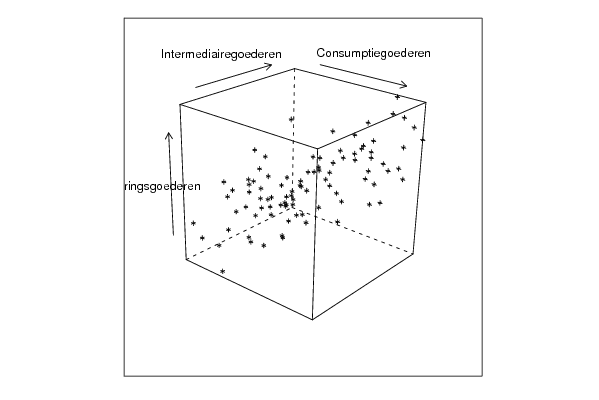
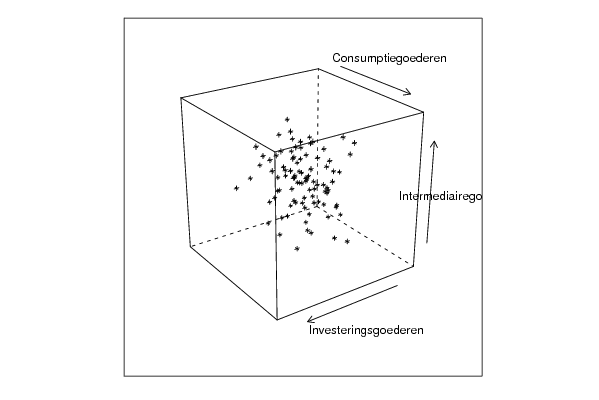
De student heeft niks vermeld over de trivariate scatterplots, nochtans kunnen deze nuttige informatie verschaffen. Hierbij kan je de correlatie nagaan tussen 3 variabelen tegelijkertijd. Er wordt telkens vanuit een ander perspectief gekeken. Via deze methode kan je dan soms dingen vaststellen die je bij de kernel density plots niet kan vaststellen.
De trivariate scatterplots zijn telkens een projectie van een kubus. Deze kunnen wel een vertekend beeld geven doordat je telkens een dimensie weglaat.
Op de trivariate scatterplots zien we min of meer een patroon van de puntenwolk. Deze ligt ongeveer volgens de diagonaal, maar de punten liggen wel zeer gespreid.
2008-11-22 15:32:16 [An Knapen] [reply
Trivariaat scatterplot geeft het gelijktijdig verband weer tussen 3 variabelen. In dit voorbeeld gaat het over het verband tussen intermediare goederen,investeringsgoederen en consumptiegoederen. Aangezien we slechts een 2-dimensionale weergave hebben, zullen we de kubus(waar het verband tussen de 3variabelen getoond wordt) verschillende keren moeten roteren. Dit geeft een vertekend beeld omdat er telkens een dimensie gereduceerd wordt.
Ik vind dat je niet duidelijk kunt aflezen tussen welke variabelen het sterkste verband is. Op elke tekening zijn de waarden min of meer hetzelfde verdeeld/verspreid. Het verband is dus overal gelijkaardig.

Post a new message
Dataseries X:
103,1
100,6
103,1
95,5
90,5
90,9
88,8
90,7
94,3
104,6
111,1
110,8
107,2
99
99
91
96,2
96,9
96,2
100,1
99
115,4
106,9
107,1
99,3
99,2
108,3
105,6
99,5
107,4
93,1
88,1
110,7
113,1
99,6
93,6
98,6
99,6
114,3
107,8
101,2
112,5
100,5
93,9
116,2
112
106,4
95,7
96
95,8
103
102,2
98,4
111,4
86,6
91,3
107,9
101,8
104,4
93,4
100,1
98,5
112,9
101,4
107,1
110,8
90,3
95,5
111,4
113
107,5
95,9
106,3
105,2
117,2
106,9
108,2
113
97,2
99,9
108,1
118,1
109,1
93,3
112,1
111,8
112,5
116,3
110,3
117,1
103,4
96,2
Dataseries Y:
119,5
125
145
105,3
116,9
120,1
88,9
78,4
114,6
113,3
117
99,6
99,4
101,9
115,2
108,5
113,8
121
92,2
90,2
101,5
126,6
93,9
89,8
93,4
101,5
110,4
105,9
108,4
113,9
86,1
69,4
101,2
100,5
98
106,6
90,1
96,9
125,9
112
100
123,9
79,8
83,4
113,6
112,9
104
109,9
99
106,3
128,9
111,1
102,9
130
87
87,5
117,6
103,4
110,8
112,6
102,5
112,4
135,6
105,1
127,7
137
91
90,5
122,4
123,3
124,3
120
118,1
119
142,7
123,6
129,6
151,6
110,4
99,2
130,5
136,2
129,7
128
121,6
135,8
143,8
147,5
136,2
156,6
123,3
100,4
Dataseries Z:
98,6
98
106,8
96,6
100,1
107,7
91,5
97,8
107,4
117,5
105,6
97,4
99,5
98
104,3
100,6
101,1
103,9
96,9
95,5
108,4
117
103,8
100,8
110,6
104
112,6
107,3
98,9
109,8
104,9
102,2
123,9
124,9
112,7
121,9
100,6
104,3
120,4
107,5
102,9
125,6
107,5
108,8
128,4
121,1
119,5
128,7
108,7
105,5
119,8
111,3
110,6
120,1
97,5
107,7
127,3
117,2
119,8
116,2
111
112,4
130,6
109,1
118,8
123,9
101,6
112,8
128
129,6
125,8
119,5
115,7
113,6
129,7
112
116,8
127
112,1
114,2
121,1
131,6
125
120,4
117,7
117,5
120,6
127,5
112,3
124,5
115,2
105,4


Summary of computational transaction
Raw Inputview raw input (R code)
Raw Outputview raw output of R engine
Computing time5 seconds
R Server'Herman Ole Andreas Wold' @ 193.190.124.10:1001

\begin{tabular}{lllllllll}
\hline
Summary of computational transaction \tabularnewline
Raw Input & view raw input (R code)  \tabularnewline
Raw Output & view raw output of R engine  \tabularnewline
Computing time & 5 seconds \tabularnewline
R Server & 'Herman Ole Andreas Wold' @ 193.190.124.10:1001 \tabularnewline
\hline
\end{tabular}
%Source: https://freestatistics.org/blog/index.php?pk=23587&T=0

[TABLE]
[ROW][C]Summary of computational transaction[/C][/ROW]
[ROW][C]Raw Input[/C][C]view raw input (R code) [/C][/ROW]
[ROW][C]Raw Output[/C][C]view raw output of R engine [/C][/ROW]
[ROW][C]Computing time[/C][C]5 seconds[/C][/ROW]
[ROW][C]R Server[/C][C]'Herman Ole Andreas Wold' @ 193.190.124.10:1001[/C][/ROW]
[/TABLE]
Source: https://freestatistics.org/blog/index.php?pk=23587&T=0

Globally Unique Identifier (entire table): ba.freestatistics.org/blog/index.php?pk=23587&T=0

As an alternative you can also use a QR Code:  

The GUIDs for individual cells are displayed in the table below:

Summary of computational transaction
Raw Inputview raw input (R code)
Raw Outputview raw output of R engine
Computing time5 seconds
R Server'Herman Ole Andreas Wold' @ 193.190.124.10:1001


Parameters (Session):
par1 = 50 ; par2 = 50 ; par3 = Y ; par4 = Y ; par5 = Intermediairegoederen ; par6 = Investeringsgoederen ; par7 = Consumptiegoederen ;
Parameters (R input):
par1 = 50 ; par2 = 50 ; par3 = Y ; par4 = Y ; par5 = Intermediairegoederen ; par6 = Investeringsgoederen ; par7 = Consumptiegoederen ;
R code (references can be found in the software module):
x <- array(x,dim=c(length(x),1))
colnames(x) <- par5
y <- array(y,dim=c(length(y),1))
colnames(y) <- par6
z <- array(z,dim=c(length(z),1))
colnames(z) <- par7
d <- data.frame(cbind(z,y,x))
colnames(d) <- list(par7,par6,par5)
par1 <- as.numeric(par1)
par2 <- as.numeric(par2)
if (par1>500) par1 <- 500
if (par2>500) par2 <- 500
if (par1<10) par1 <- 10
if (par2<10) par2 <- 10
library(GenKern)
library(lattice)
panel.hist <- function(x, ...)
{
usr <- par('usr'); on.exit(par(usr))
par(usr = c(usr[1:2], 0, 1.5) )
h <- hist(x, plot = FALSE)
breaks <- h$breaks; nB <- length(breaks)
y <- h$counts; y <- y/max(y)
rect(breaks[-nB], 0, breaks[-1], y, col='black', ...)
}
bitmap(file='cloud1.png')
cloud(z~x*y, screen = list(x=-45, y=45, z=35),xlab=par5,ylab=par6,zlab=par7)
dev.off()
bitmap(file='cloud2.png')
cloud(z~x*y, screen = list(x=35, y=45, z=25),xlab=par5,ylab=par6,zlab=par7)
dev.off()
bitmap(file='cloud3.png')
cloud(z~x*y, screen = list(x=35, y=-25, z=90),xlab=par5,ylab=par6,zlab=par7)
dev.off()
bitmap(file='pairs.png')
pairs(d,diag.panel=panel.hist)
dev.off()
x <- as.vector(x)
y <- as.vector(y)
z <- as.vector(z)
bitmap(file='bidensity1.png')
op <- KernSur(x,y, xgridsize=par1, ygridsize=par2, correlation=cor(x,y), xbandwidth=dpik(x), ybandwidth=dpik(y))
image(op$xords, op$yords, op$zden, col=terrain.colors(100), axes=TRUE,main='Bivariate Kernel Density Plot (x,y)',xlab=par5,ylab=par6)
if (par3=='Y') contour(op$xords, op$yords, op$zden, add=TRUE)
if (par4=='Y') points(x,y)
(r<-lm(y ~ x))
abline(r)
box()
dev.off()
bitmap(file='bidensity2.png')
op <- KernSur(y,z, xgridsize=par1, ygridsize=par2, correlation=cor(y,z), xbandwidth=dpik(y), ybandwidth=dpik(z))
op
image(op$xords, op$yords, op$zden, col=terrain.colors(100), axes=TRUE,main='Bivariate Kernel Density Plot (y,z)',xlab=par6,ylab=par7)
if (par3=='Y') contour(op$xords, op$yords, op$zden, add=TRUE)
if (par4=='Y') points(y,z)
(r<-lm(z ~ y))
abline(r)
box()
dev.off()
bitmap(file='bidensity3.png')
op <- KernSur(x,z, xgridsize=par1, ygridsize=par2, correlation=cor(x,z), xbandwidth=dpik(x), ybandwidth=dpik(z))
op
image(op$xords, op$yords, op$zden, col=terrain.colors(100), axes=TRUE,main='Bivariate Kernel Density Plot (x,z)',xlab=par5,ylab=par7)
if (par3=='Y') contour(op$xords, op$yords, op$zden, add=TRUE)
if (par4=='Y') points(x,z)
(r<-lm(z ~ x))
abline(r)
box()
dev.off()