Free Statistics

of Irreproducible Research!

Author's title

Author*The author of this computation has been verified*
R Software Modulerwasp_hierarchicalclustering.wasp
Title produced by softwareHierarchical Clustering
Date of computationTue, 11 Nov 2008 08:06:49 -0700
Cite this page as followsStatistical Computations at FreeStatistics.org, Office for Research Development and Education, URL https://freestatistics.org/blog/index.php?v=date/2008/Nov/11/t12264160689cbslhbj5f15kmr.htm/, Retrieved Sun, 19 May 2024 11:36:22 +0000
Statistical Computations at FreeStatistics.org, Office for Research Development and Education, URL https://freestatistics.org/blog/index.php?pk=23569, Retrieved Sun, 19 May 2024 11:36:22 +0000
QR Codes:

Original text written by user:
IsPrivate?No (this computation is public)
User-defined keywords
Estimated Impact113
Family? (F = Feedback message, R = changed R code, M = changed R Module, P = changed Parameters, D = changed Data)
-       [Hierarchical Clustering] [Various EDA topic...] [2008-11-11 15:06:49] [821c4b3d195be8e737cf8c9dc649d3cf] [Current]
Feedback Forum

Post a new message
Dataseries X:
10068	4923	5145
10101	4940	5161
10131	4956	5175
10143	4959	5184
10170	4972	5198
10192	4983	5209
10214	4994	5220
10239	5007	5233
10263	5018	5245
10310	5042	5268
10355	5068	5288
10396	5087	5309
10446	5112	5334
10511	5144	5367
10585	5182	5402
10667	5224	5443


Summary of computational transaction
Raw Inputview raw input (R code)
Raw Outputview raw output of R engine
Computing time1 seconds
R Server'George Udny Yule' @ 72.249.76.132

\begin{tabular}{lllllllll}
\hline
Summary of computational transaction \tabularnewline
Raw Input & view raw input (R code)  \tabularnewline
Raw Output & view raw output of R engine  \tabularnewline
Computing time & 1 seconds \tabularnewline
R Server & 'George Udny Yule' @ 72.249.76.132 \tabularnewline
\hline
\end{tabular}
%Source: https://freestatistics.org/blog/index.php?pk=23569&T=0

[TABLE]
[ROW][C]Summary of computational transaction[/C][/ROW]
[ROW][C]Raw Input[/C][C]view raw input (R code) [/C][/ROW]
[ROW][C]Raw Output[/C][C]view raw output of R engine [/C][/ROW]
[ROW][C]Computing time[/C][C]1 seconds[/C][/ROW]
[ROW][C]R Server[/C][C]'George Udny Yule' @ 72.249.76.132[/C][/ROW]
[/TABLE]
Source: https://freestatistics.org/blog/index.php?pk=23569&T=0

Globally Unique Identifier (entire table): ba.freestatistics.org/blog/index.php?pk=23569&T=0

As an alternative you can also use a QR Code:  

The GUIDs for individual cells are displayed in the table below:

Summary of computational transaction
Raw Inputview raw input (R code)
Raw Outputview raw output of R engine
Computing time1 seconds
R Server'George Udny Yule' @ 72.249.76.132


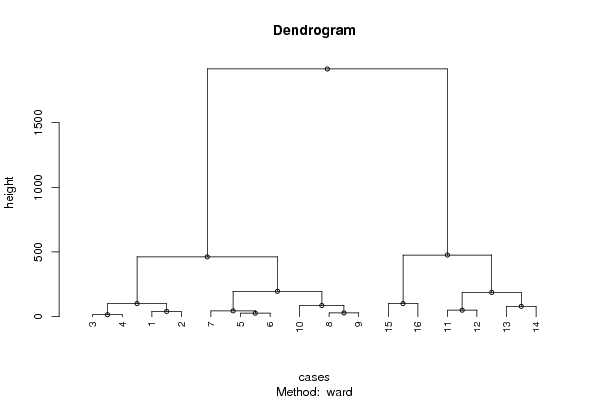
Summary of Dendrogram
LabelHeight
115.2970585407784
226.9443871706150
329
440.4227658628155
544.9073119510249
649.829710013204
779.6115569499806
886.411943409931
9100.817577337982
10100.841459727634
11187.181039862771
12195.822698108476
13462.299461566958
14476.37243683201
151915.14623707226

\begin{tabular}{lllllllll}
\hline
Summary of Dendrogram \tabularnewline
Label & Height \tabularnewline
1 & 15.2970585407784 \tabularnewline
2 & 26.9443871706150 \tabularnewline
3 & 29 \tabularnewline
4 & 40.4227658628155 \tabularnewline
5 & 44.9073119510249 \tabularnewline
6 & 49.829710013204 \tabularnewline
7 & 79.6115569499806 \tabularnewline
8 & 86.411943409931 \tabularnewline
9 & 100.817577337982 \tabularnewline
10 & 100.841459727634 \tabularnewline
11 & 187.181039862771 \tabularnewline
12 & 195.822698108476 \tabularnewline
13 & 462.299461566958 \tabularnewline
14 & 476.37243683201 \tabularnewline
15 & 1915.14623707226 \tabularnewline
\hline
\end{tabular}
%Source: https://freestatistics.org/blog/index.php?pk=23569&T=1

[TABLE]
[ROW][C]Summary of Dendrogram[/C][/ROW]
[ROW][C]Label[/C][C]Height[/C][/ROW]
[ROW][C]1[/C][C]15.2970585407784[/C][/ROW]
[ROW][C]2[/C][C]26.9443871706150[/C][/ROW]
[ROW][C]3[/C][C]29[/C][/ROW]
[ROW][C]4[/C][C]40.4227658628155[/C][/ROW]
[ROW][C]5[/C][C]44.9073119510249[/C][/ROW]
[ROW][C]6[/C][C]49.829710013204[/C][/ROW]
[ROW][C]7[/C][C]79.6115569499806[/C][/ROW]
[ROW][C]8[/C][C]86.411943409931[/C][/ROW]
[ROW][C]9[/C][C]100.817577337982[/C][/ROW]
[ROW][C]10[/C][C]100.841459727634[/C][/ROW]
[ROW][C]11[/C][C]187.181039862771[/C][/ROW]
[ROW][C]12[/C][C]195.822698108476[/C][/ROW]
[ROW][C]13[/C][C]462.299461566958[/C][/ROW]
[ROW][C]14[/C][C]476.37243683201[/C][/ROW]
[ROW][C]15[/C][C]1915.14623707226[/C][/ROW]
[/TABLE]
Source: https://freestatistics.org/blog/index.php?pk=23569&T=1

Globally Unique Identifier (entire table): ba.freestatistics.org/blog/index.php?pk=23569&T=1

As an alternative you can also use a QR Code:  

The GUIDs for individual cells are displayed in the table below:

Summary of Dendrogram
LabelHeight
115.2970585407784
226.9443871706150
329
440.4227658628155
544.9073119510249
649.829710013204
779.6115569499806
886.411943409931
9100.817577337982
10100.841459727634
11187.181039862771
12195.822698108476
13462.299461566958
14476.37243683201
151915.14623707226


Parameters (Session):
par1 = ward ; par2 = ALL ; par3 = FALSE ; par4 = FALSE ;
Parameters (R input):
par1 = ward ; par2 = ALL ; par3 = FALSE ; par4 = FALSE ;
R code (references can be found in the software module):
par3 <- as.logical(par3)
par4 <- as.logical(par4)
if (par3 == 'TRUE'){
dum = xlab
xlab = ylab
ylab = dum
}
x <- t(y)
hc <- hclust(dist(x),method=par1)
d <- as.dendrogram(hc)
str(d)
mysub <- paste('Method: ',par1)
bitmap(file='test1.png')
if (par4 == 'TRUE'){
plot(d,main=main,ylab=ylab,xlab=xlab,horiz=par3, nodePar=list(pch = c(1,NA), cex=0.8, lab.cex = 0.8),type='t',center=T, sub=mysub)
} else {
plot(d,main=main,ylab=ylab,xlab=xlab,horiz=par3, nodePar=list(pch = c(1,NA), cex=0.8, lab.cex = 0.8), sub=mysub)
}
dev.off()
if (par2 != 'ALL'){
if (par3 == 'TRUE'){
ylab = 'cluster'
} else {
xlab = 'cluster'
}
par2 <- as.numeric(par2)
memb <- cutree(hc, k = par2)
cent <- NULL
for(k in 1:par2){
cent <- rbind(cent, colMeans(x[memb == k, , drop = FALSE]))
}
hc1 <- hclust(dist(cent),method=par1, members = table(memb))
de <- as.dendrogram(hc1)
bitmap(file='test2.png')
if (par4 == 'TRUE'){
plot(de,main=main,ylab=ylab,xlab=xlab,horiz=par3, nodePar=list(pch = c(1,NA), cex=0.8, lab.cex = 0.8),type='t',center=T, sub=mysub)
} else {
plot(de,main=main,ylab=ylab,xlab=xlab,horiz=par3, nodePar=list(pch = c(1,NA), cex=0.8, lab.cex = 0.8), sub=mysub)
}
dev.off()
str(de)
}
load(file='createtable')
a<-table.start()
a<-table.row.start(a)
a<-table.element(a,'Summary of Dendrogram',2,TRUE)
a<-table.row.end(a)
a<-table.row.start(a)
a<-table.element(a,'Label',header=TRUE)
a<-table.element(a,'Height',header=TRUE)
a<-table.row.end(a)
num <- length(x[,1])-1
for (i in 1:num)
{
a<-table.row.start(a)
a<-table.element(a,hc$labels[i])
a<-table.element(a,hc$height[i])
a<-table.row.end(a)
}
a<-table.end(a)
table.save(a,file='mytable1.tab')
if (par2 != 'ALL'){
a<-table.start()
a<-table.row.start(a)
a<-table.element(a,'Summary of Cut Dendrogram',2,TRUE)
a<-table.row.end(a)
a<-table.row.start(a)
a<-table.element(a,'Label',header=TRUE)
a<-table.element(a,'Height',header=TRUE)
a<-table.row.end(a)
num <- par2-1
for (i in 1:num)
{
a<-table.row.start(a)
a<-table.element(a,i)
a<-table.element(a,hc1$height[i])
a<-table.row.end(a)
}
a<-table.end(a)
table.save(a,file='mytable2.tab')
}