Free Statistics

of Irreproducible Research!

Author's title

Author*The author of this computation has been verified*
R Software Modulerwasp_hierarchicalclustering.wasp
Title produced by softwareHierarchical Clustering
Date of computationTue, 11 Nov 2008 08:02:00 -0700
Cite this page as followsStatistical Computations at FreeStatistics.org, Office for Research Development and Education, URL https://freestatistics.org/blog/index.php?v=date/2008/Nov/11/t1226415755whvzodbnsbusq54.htm/, Retrieved Sun, 19 May 2024 10:04:55 +0000
Statistical Computations at FreeStatistics.org, Office for Research Development and Education, URL https://freestatistics.org/blog/index.php?pk=23562, Retrieved Sun, 19 May 2024 10:04:55 +0000
QR Codes:

Original text written by user:
IsPrivate?No (this computation is public)
User-defined keywords
Estimated Impact120
Family? (F = Feedback message, R = changed R code, M = changed R Module, P = changed Parameters, D = changed Data)
F       [Hierarchical Clustering] [Hierarchical Clus...] [2008-11-11 15:02:00] [5d823194959040fa9b19b8c8302177e6] [Current]
Feedback Forum
2008-11-19 13:47:29 [2df1bcd103d52957f4a39bd4617794c8] [reply
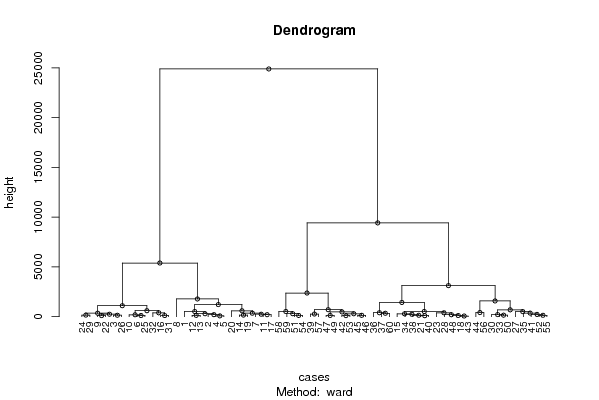
We noteren dat de gegevens sterk verdeeld zijn in 2 groepen. Je kan op deze wijze blijven splitsen tot je bij 1 observatie komt.

Deze techniek is exploratief om gegevens te verkennen, minder handig om tijdsreeksen te bestuderen.


Post a new message
Dataseries X:
3134.5	2236	3258.1
3510.5	2084.9	3140.1
4047.4	2409.5	3627.4
3580.8	2199.3	3279.4
3567.3	2203.5	3204
3920.1	2254.1	3515.6
3764.8	1975.8	3146.6
3139.3	1742.2	2271.7
4126.1	2520.6	3627.9
3920	2438.1	3553.4
3868.3	2126.3	3018.3
3414	2267.5	3355.4
3423.4	2201.1	3242
3819	2128.5	3311.1
4482.7	2596	4125.2
4040.4	2458.2	3423
3720.3	2210.5	3120.3
4405	2621.2	3863
3916.6	2231.4	3240.8
3540.5	2103.6	2837.4
4486.4	2685.8	3945
4213.6	2539.3	3684.1
4521.7	2462.4	3659.6
4102.3	2693.3	3769.6
3854.1	2307.7	3592.7
4106.5	2385.9	3754
4870.9	2737.6	4507.8
4559.7	2653.9	3853.2
4072.1	2545.4	3817.2
4687.7	2848.8	3958.4
4096.1	2359.5	3428.9
4107.2	2488.3	3125.7
4888	2861.1	3977
4256.2	2717.9	3983.3
4593.8	2844	4299.6
3888.2	2749	4306.9
4232.7	2652.9	4259.5
4386.2	2660.2	3986
5203.6	3187.1	4755.6
4456.6	2774.1	3925.6
4828.4	3158.2	4206.5
5244.6	3244.6	4323.4
4407.6	2665.5	3816.1
4809.3	2820.8	3410.7
5226.8	2983.4	4227.4
5290.2	3077.4	4296.9
5068.8	3024.8	4351.7
4425.2	2731.8	3800
4971	3046.2	4277
4806.9	2834.8	4100.2
5565.8	3292.8	4672.5
4754.9	2946.1	4189.9
5220	3196.9	4231.9
5684.3	3284.2	4654.9
4815.3	3003	4298.5
5114.4	2979	3635.9
5273.9	3137.4	4505.1
5602.6	3647.7	4910.1
5609.7	3283	4908.7
4168.9	2947.3	4101.4


Summary of computational transaction
Raw Inputview raw input (R code)
Raw Outputview raw output of R engine
Computing time1 seconds
R Server'Gwilym Jenkins' @ 72.249.127.135

\begin{tabular}{lllllllll}
\hline
Summary of computational transaction \tabularnewline
Raw Input & view raw input (R code)  \tabularnewline
Raw Output & view raw output of R engine  \tabularnewline
Computing time & 1 seconds \tabularnewline
R Server & 'Gwilym Jenkins' @ 72.249.127.135 \tabularnewline
\hline
\end{tabular}
%Source: https://freestatistics.org/blog/index.php?pk=23562&T=0

[TABLE]
[ROW][C]Summary of computational transaction[/C][/ROW]
[ROW][C]Raw Input[/C][C]view raw input (R code) [/C][/ROW]
[ROW][C]Raw Output[/C][C]view raw output of R engine [/C][/ROW]
[ROW][C]Computing time[/C][C]1 seconds[/C][/ROW]
[ROW][C]R Server[/C][C]'Gwilym Jenkins' @ 72.249.127.135[/C][/ROW]
[/TABLE]
Source: https://freestatistics.org/blog/index.php?pk=23562&T=0

Globally Unique Identifier (entire table): ba.freestatistics.org/blog/index.php?pk=23562&T=0

As an alternative you can also use a QR Code:  

The GUIDs for individual cells are displayed in the table below:

Summary of computational transaction
Raw Inputview raw input (R code)
Raw Outputview raw output of R engine
Computing time1 seconds
R Server'Gwilym Jenkins' @ 72.249.127.135


Summary of Dendrogram
LabelHeight
164.5667096885076
276.7140795421545
395.1908083798006
4105.661629743252
5106.078744336460
6111.36963319427
7113.485637857836
8114.775302221340
9120.108159589597
10124.91152869131
11131.745512257534
12132.988006978073
13136.67380875647
14140.364523769334
15141.694495305922
16149.823696390124
17158.278899414925
18158.291692770025
19187.836139403329
20195.862469794195
21198.488387569651
22200.883202336645
23208.266217225146
24225.096176037255
25238.010323945937
26242.861456877543
27246.218202047468
28264.881917087596
29283.305924102693
30290.920486463546
31292.606564501356
32296.619995478228
33340.2020135155
34349.149908239187
35351.779678724116
36357.412512360007
37386.041769835998
38388.660843304147
39394.07387583313
40410.887198632422
41475.309105794374
42504.847609953372
43515.280076130252
44516.83175589274
45518.336574713866
46590.512830722184
47598.25100424429
48685.812033160692
49698.801875269814
501100.22866738782
511212.52945183441
521426.62414787103
531577.2904630616
541776.19811026794
552372.25090698310
563119.23804346328
575389.62080817829
589420.00379591854
5924887.1963551938

\begin{tabular}{lllllllll}
\hline
Summary of Dendrogram \tabularnewline
Label & Height \tabularnewline
1 & 64.5667096885076 \tabularnewline
2 & 76.7140795421545 \tabularnewline
3 & 95.1908083798006 \tabularnewline
4 & 105.661629743252 \tabularnewline
5 & 106.078744336460 \tabularnewline
6 & 111.36963319427 \tabularnewline
7 & 113.485637857836 \tabularnewline
8 & 114.775302221340 \tabularnewline
9 & 120.108159589597 \tabularnewline
10 & 124.91152869131 \tabularnewline
11 & 131.745512257534 \tabularnewline
12 & 132.988006978073 \tabularnewline
13 & 136.67380875647 \tabularnewline
14 & 140.364523769334 \tabularnewline
15 & 141.694495305922 \tabularnewline
16 & 149.823696390124 \tabularnewline
17 & 158.278899414925 \tabularnewline
18 & 158.291692770025 \tabularnewline
19 & 187.836139403329 \tabularnewline
20 & 195.862469794195 \tabularnewline
21 & 198.488387569651 \tabularnewline
22 & 200.883202336645 \tabularnewline
23 & 208.266217225146 \tabularnewline
24 & 225.096176037255 \tabularnewline
25 & 238.010323945937 \tabularnewline
26 & 242.861456877543 \tabularnewline
27 & 246.218202047468 \tabularnewline
28 & 264.881917087596 \tabularnewline
29 & 283.305924102693 \tabularnewline
30 & 290.920486463546 \tabularnewline
31 & 292.606564501356 \tabularnewline
32 & 296.619995478228 \tabularnewline
33 & 340.2020135155 \tabularnewline
34 & 349.149908239187 \tabularnewline
35 & 351.779678724116 \tabularnewline
36 & 357.412512360007 \tabularnewline
37 & 386.041769835998 \tabularnewline
38 & 388.660843304147 \tabularnewline
39 & 394.07387583313 \tabularnewline
40 & 410.887198632422 \tabularnewline
41 & 475.309105794374 \tabularnewline
42 & 504.847609953372 \tabularnewline
43 & 515.280076130252 \tabularnewline
44 & 516.83175589274 \tabularnewline
45 & 518.336574713866 \tabularnewline
46 & 590.512830722184 \tabularnewline
47 & 598.25100424429 \tabularnewline
48 & 685.812033160692 \tabularnewline
49 & 698.801875269814 \tabularnewline
50 & 1100.22866738782 \tabularnewline
51 & 1212.52945183441 \tabularnewline
52 & 1426.62414787103 \tabularnewline
53 & 1577.2904630616 \tabularnewline
54 & 1776.19811026794 \tabularnewline
55 & 2372.25090698310 \tabularnewline
56 & 3119.23804346328 \tabularnewline
57 & 5389.62080817829 \tabularnewline
58 & 9420.00379591854 \tabularnewline
59 & 24887.1963551938 \tabularnewline
\hline
\end{tabular}
%Source: https://freestatistics.org/blog/index.php?pk=23562&T=1

[TABLE]
[ROW][C]Summary of Dendrogram[/C][/ROW]
[ROW][C]Label[/C][C]Height[/C][/ROW]
[ROW][C]1[/C][C]64.5667096885076[/C][/ROW]
[ROW][C]2[/C][C]76.7140795421545[/C][/ROW]
[ROW][C]3[/C][C]95.1908083798006[/C][/ROW]
[ROW][C]4[/C][C]105.661629743252[/C][/ROW]
[ROW][C]5[/C][C]106.078744336460[/C][/ROW]
[ROW][C]6[/C][C]111.36963319427[/C][/ROW]
[ROW][C]7[/C][C]113.485637857836[/C][/ROW]
[ROW][C]8[/C][C]114.775302221340[/C][/ROW]
[ROW][C]9[/C][C]120.108159589597[/C][/ROW]
[ROW][C]10[/C][C]124.91152869131[/C][/ROW]
[ROW][C]11[/C][C]131.745512257534[/C][/ROW]
[ROW][C]12[/C][C]132.988006978073[/C][/ROW]
[ROW][C]13[/C][C]136.67380875647[/C][/ROW]
[ROW][C]14[/C][C]140.364523769334[/C][/ROW]
[ROW][C]15[/C][C]141.694495305922[/C][/ROW]
[ROW][C]16[/C][C]149.823696390124[/C][/ROW]
[ROW][C]17[/C][C]158.278899414925[/C][/ROW]
[ROW][C]18[/C][C]158.291692770025[/C][/ROW]
[ROW][C]19[/C][C]187.836139403329[/C][/ROW]
[ROW][C]20[/C][C]195.862469794195[/C][/ROW]
[ROW][C]21[/C][C]198.488387569651[/C][/ROW]
[ROW][C]22[/C][C]200.883202336645[/C][/ROW]
[ROW][C]23[/C][C]208.266217225146[/C][/ROW]
[ROW][C]24[/C][C]225.096176037255[/C][/ROW]
[ROW][C]25[/C][C]238.010323945937[/C][/ROW]
[ROW][C]26[/C][C]242.861456877543[/C][/ROW]
[ROW][C]27[/C][C]246.218202047468[/C][/ROW]
[ROW][C]28[/C][C]264.881917087596[/C][/ROW]
[ROW][C]29[/C][C]283.305924102693[/C][/ROW]
[ROW][C]30[/C][C]290.920486463546[/C][/ROW]
[ROW][C]31[/C][C]292.606564501356[/C][/ROW]
[ROW][C]32[/C][C]296.619995478228[/C][/ROW]
[ROW][C]33[/C][C]340.2020135155[/C][/ROW]
[ROW][C]34[/C][C]349.149908239187[/C][/ROW]
[ROW][C]35[/C][C]351.779678724116[/C][/ROW]
[ROW][C]36[/C][C]357.412512360007[/C][/ROW]
[ROW][C]37[/C][C]386.041769835998[/C][/ROW]
[ROW][C]38[/C][C]388.660843304147[/C][/ROW]
[ROW][C]39[/C][C]394.07387583313[/C][/ROW]
[ROW][C]40[/C][C]410.887198632422[/C][/ROW]
[ROW][C]41[/C][C]475.309105794374[/C][/ROW]
[ROW][C]42[/C][C]504.847609953372[/C][/ROW]
[ROW][C]43[/C][C]515.280076130252[/C][/ROW]
[ROW][C]44[/C][C]516.83175589274[/C][/ROW]
[ROW][C]45[/C][C]518.336574713866[/C][/ROW]
[ROW][C]46[/C][C]590.512830722184[/C][/ROW]
[ROW][C]47[/C][C]598.25100424429[/C][/ROW]
[ROW][C]48[/C][C]685.812033160692[/C][/ROW]
[ROW][C]49[/C][C]698.801875269814[/C][/ROW]
[ROW][C]50[/C][C]1100.22866738782[/C][/ROW]
[ROW][C]51[/C][C]1212.52945183441[/C][/ROW]
[ROW][C]52[/C][C]1426.62414787103[/C][/ROW]
[ROW][C]53[/C][C]1577.2904630616[/C][/ROW]
[ROW][C]54[/C][C]1776.19811026794[/C][/ROW]
[ROW][C]55[/C][C]2372.25090698310[/C][/ROW]
[ROW][C]56[/C][C]3119.23804346328[/C][/ROW]
[ROW][C]57[/C][C]5389.62080817829[/C][/ROW]
[ROW][C]58[/C][C]9420.00379591854[/C][/ROW]
[ROW][C]59[/C][C]24887.1963551938[/C][/ROW]
[/TABLE]
Source: https://freestatistics.org/blog/index.php?pk=23562&T=1

Globally Unique Identifier (entire table): ba.freestatistics.org/blog/index.php?pk=23562&T=1

As an alternative you can also use a QR Code:  

The GUIDs for individual cells are displayed in the table below:

Summary of Dendrogram
LabelHeight
164.5667096885076
276.7140795421545
395.1908083798006
4105.661629743252
5106.078744336460
6111.36963319427
7113.485637857836
8114.775302221340
9120.108159589597
10124.91152869131
11131.745512257534
12132.988006978073
13136.67380875647
14140.364523769334
15141.694495305922
16149.823696390124
17158.278899414925
18158.291692770025
19187.836139403329
20195.862469794195
21198.488387569651
22200.883202336645
23208.266217225146
24225.096176037255
25238.010323945937
26242.861456877543
27246.218202047468
28264.881917087596
29283.305924102693
30290.920486463546
31292.606564501356
32296.619995478228
33340.2020135155
34349.149908239187
35351.779678724116
36357.412512360007
37386.041769835998
38388.660843304147
39394.07387583313
40410.887198632422
41475.309105794374
42504.847609953372
43515.280076130252
44516.83175589274
45518.336574713866
46590.512830722184
47598.25100424429
48685.812033160692
49698.801875269814
501100.22866738782
511212.52945183441
521426.62414787103
531577.2904630616
541776.19811026794
552372.25090698310
563119.23804346328
575389.62080817829
589420.00379591854
5924887.1963551938


Parameters (Session):
par1 = ward ; par2 = ALL ; par3 = FALSE ; par4 = FALSE ;
Parameters (R input):
par1 = ward ; par2 = ALL ; par3 = FALSE ; par4 = FALSE ;
R code (references can be found in the software module):
par3 <- as.logical(par3)
par4 <- as.logical(par4)
if (par3 == 'TRUE'){
dum = xlab
xlab = ylab
ylab = dum
}
x <- t(y)
hc <- hclust(dist(x),method=par1)
d <- as.dendrogram(hc)
str(d)
mysub <- paste('Method: ',par1)
bitmap(file='test1.png')
if (par4 == 'TRUE'){
plot(d,main=main,ylab=ylab,xlab=xlab,horiz=par3, nodePar=list(pch = c(1,NA), cex=0.8, lab.cex = 0.8),type='t',center=T, sub=mysub)
} else {
plot(d,main=main,ylab=ylab,xlab=xlab,horiz=par3, nodePar=list(pch = c(1,NA), cex=0.8, lab.cex = 0.8), sub=mysub)
}
dev.off()
if (par2 != 'ALL'){
if (par3 == 'TRUE'){
ylab = 'cluster'
} else {
xlab = 'cluster'
}
par2 <- as.numeric(par2)
memb <- cutree(hc, k = par2)
cent <- NULL
for(k in 1:par2){
cent <- rbind(cent, colMeans(x[memb == k, , drop = FALSE]))
}
hc1 <- hclust(dist(cent),method=par1, members = table(memb))
de <- as.dendrogram(hc1)
bitmap(file='test2.png')
if (par4 == 'TRUE'){
plot(de,main=main,ylab=ylab,xlab=xlab,horiz=par3, nodePar=list(pch = c(1,NA), cex=0.8, lab.cex = 0.8),type='t',center=T, sub=mysub)
} else {
plot(de,main=main,ylab=ylab,xlab=xlab,horiz=par3, nodePar=list(pch = c(1,NA), cex=0.8, lab.cex = 0.8), sub=mysub)
}
dev.off()
str(de)
}
load(file='createtable')
a<-table.start()
a<-table.row.start(a)
a<-table.element(a,'Summary of Dendrogram',2,TRUE)
a<-table.row.end(a)
a<-table.row.start(a)
a<-table.element(a,'Label',header=TRUE)
a<-table.element(a,'Height',header=TRUE)
a<-table.row.end(a)
num <- length(x[,1])-1
for (i in 1:num)
{
a<-table.row.start(a)
a<-table.element(a,hc$labels[i])
a<-table.element(a,hc$height[i])
a<-table.row.end(a)
}
a<-table.end(a)
table.save(a,file='mytable1.tab')
if (par2 != 'ALL'){
a<-table.start()
a<-table.row.start(a)
a<-table.element(a,'Summary of Cut Dendrogram',2,TRUE)
a<-table.row.end(a)
a<-table.row.start(a)
a<-table.element(a,'Label',header=TRUE)
a<-table.element(a,'Height',header=TRUE)
a<-table.row.end(a)
num <- par2-1
for (i in 1:num)
{
a<-table.row.start(a)
a<-table.element(a,i)
a<-table.element(a,hc1$height[i])
a<-table.row.end(a)
}
a<-table.end(a)
table.save(a,file='mytable2.tab')
}