Free Statistics

of Irreproducible Research!

Author's title

Author*The author of this computation has been verified*
R Software Modulerwasp_hierarchicalclustering.wasp
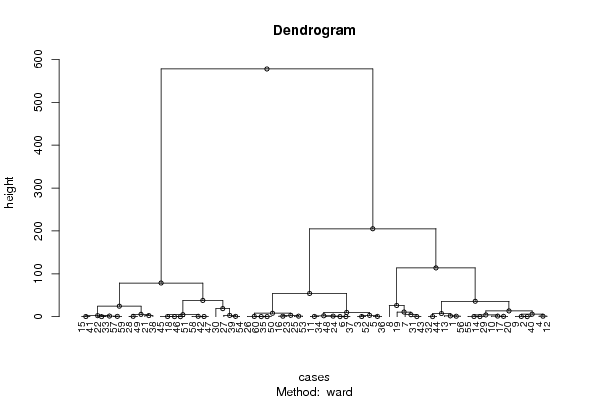
Title produced by softwareHierarchical Clustering
Date of computationTue, 11 Nov 2008 07:33:21 -0700
Cite this page as followsStatistical Computations at FreeStatistics.org, Office for Research Development and Education, URL https://freestatistics.org/blog/index.php?v=date/2008/Nov/11/t1226414033fsanx0ugfcdn3ql.htm/, Retrieved Sun, 19 May 2024 11:29:58 +0000
Statistical Computations at FreeStatistics.org, Office for Research Development and Education, URL https://freestatistics.org/blog/index.php?pk=23533, Retrieved Sun, 19 May 2024 11:29:58 +0000
QR Codes:

Original text written by user:
IsPrivate?No (this computation is public)
User-defined keywords
Estimated Impact126
Family? (F = Feedback message, R = changed R code, M = changed R Module, P = changed Parameters, D = changed Data)
-       [Hierarchical Clustering] [Q2-4] [2008-11-11 14:33:21] [541f63fa3157af9df10fc4d202b2a90b] [Current]
Feedback Forum

Post a new message
Dataseries X:
91,2
99,2
108,2
101,5
106,9
104,4
77,9
60
99,5
95
105,6
102,5
93,3
97,3
127
111,7
96,4
133
72,2
95,8
124,1
127,6
110,7
104,6
112,7
115,3
139,4
119
97,4
154
81,5
88,8
127,7
105,1
114,9
106,4
104,5
121,6
141,4
99
126,7
134,1
81,3
88,6
132,7
132,9
134,4
103,7
119,7
115
132,9
108,5
113,9
142
97,7
92,2
128,8
134,9
128,2
114,8


Summary of computational transaction
Raw Inputview raw input (R code)
Raw Outputview raw output of R engine
Computing time2 seconds
R Server'Herman Ole Andreas Wold' @ 193.190.124.10:1001

\begin{tabular}{lllllllll}
\hline
Summary of computational transaction \tabularnewline
Raw Input & view raw input (R code)  \tabularnewline
Raw Output & view raw output of R engine  \tabularnewline
Computing time & 2 seconds \tabularnewline
R Server & 'Herman Ole Andreas Wold' @ 193.190.124.10:1001 \tabularnewline
\hline
\end{tabular}
%Source: https://freestatistics.org/blog/index.php?pk=23533&T=0

[TABLE]
[ROW][C]Summary of computational transaction[/C][/ROW]
[ROW][C]Raw Input[/C][C]view raw input (R code) [/C][/ROW]
[ROW][C]Raw Output[/C][C]view raw output of R engine [/C][/ROW]
[ROW][C]Computing time[/C][C]2 seconds[/C][/ROW]
[ROW][C]R Server[/C][C]'Herman Ole Andreas Wold' @ 193.190.124.10:1001[/C][/ROW]
[/TABLE]
Source: https://freestatistics.org/blog/index.php?pk=23533&T=0

Globally Unique Identifier (entire table): ba.freestatistics.org/blog/index.php?pk=23533&T=0

As an alternative you can also use a QR Code:  

The GUIDs for individual cells are displayed in the table below:

Summary of computational transaction
Raw Inputview raw input (R code)
Raw Outputview raw output of R engine
Computing time2 seconds
R Server'Herman Ole Andreas Wold' @ 193.190.124.10:1001


Summary of Dendrogram
LabelHeight
10
20.0999999999999943
30.0999999999999943
40.100000000000009
50.100000000000009
60.133333333333326
70.166666666666657
80.166666666666676
90.200000000000003
100.200000000000003
110.200000000000003
120.299999999999997
130.299999999999997
140.300000000000011
150.316666666666691
160.433333333333332
170.466666666666664
180.5
190.5
200.533333333333327
210.599999999999994
220.600000000000009
230.600000000000023
240.700000000000003
250.76666666666667
261
271
281
291.13333333333333
301.20000000000000
311.26666666666667
321.34999999999999
331.79999999999999
341.99999999999999
352.38333333333332
362.5
372.86666666666666
382.99999999999999
393.1
404.00000000000000
414.59999999999999
424.65476190476190
435.39999999999998
445.77333333333333
457.24000000000001
467.94999999999999
479.84000000000004
4810.85
4913.4327272727273
5018.7333333333333
5124.4666666666667
5226.03
5335.8622727272727
5437.8103896103896
5554.0433333333334
5678.456277056277
57113.687857142857
58205.008424908425
59577.720622710623

\begin{tabular}{lllllllll}
\hline
Summary of Dendrogram \tabularnewline
Label & Height \tabularnewline
1 & 0 \tabularnewline
2 & 0.0999999999999943 \tabularnewline
3 & 0.0999999999999943 \tabularnewline
4 & 0.100000000000009 \tabularnewline
5 & 0.100000000000009 \tabularnewline
6 & 0.133333333333326 \tabularnewline
7 & 0.166666666666657 \tabularnewline
8 & 0.166666666666676 \tabularnewline
9 & 0.200000000000003 \tabularnewline
10 & 0.200000000000003 \tabularnewline
11 & 0.200000000000003 \tabularnewline
12 & 0.299999999999997 \tabularnewline
13 & 0.299999999999997 \tabularnewline
14 & 0.300000000000011 \tabularnewline
15 & 0.316666666666691 \tabularnewline
16 & 0.433333333333332 \tabularnewline
17 & 0.466666666666664 \tabularnewline
18 & 0.5 \tabularnewline
19 & 0.5 \tabularnewline
20 & 0.533333333333327 \tabularnewline
21 & 0.599999999999994 \tabularnewline
22 & 0.600000000000009 \tabularnewline
23 & 0.600000000000023 \tabularnewline
24 & 0.700000000000003 \tabularnewline
25 & 0.76666666666667 \tabularnewline
26 & 1 \tabularnewline
27 & 1 \tabularnewline
28 & 1 \tabularnewline
29 & 1.13333333333333 \tabularnewline
30 & 1.20000000000000 \tabularnewline
31 & 1.26666666666667 \tabularnewline
32 & 1.34999999999999 \tabularnewline
33 & 1.79999999999999 \tabularnewline
34 & 1.99999999999999 \tabularnewline
35 & 2.38333333333332 \tabularnewline
36 & 2.5 \tabularnewline
37 & 2.86666666666666 \tabularnewline
38 & 2.99999999999999 \tabularnewline
39 & 3.1 \tabularnewline
40 & 4.00000000000000 \tabularnewline
41 & 4.59999999999999 \tabularnewline
42 & 4.65476190476190 \tabularnewline
43 & 5.39999999999998 \tabularnewline
44 & 5.77333333333333 \tabularnewline
45 & 7.24000000000001 \tabularnewline
46 & 7.94999999999999 \tabularnewline
47 & 9.84000000000004 \tabularnewline
48 & 10.85 \tabularnewline
49 & 13.4327272727273 \tabularnewline
50 & 18.7333333333333 \tabularnewline
51 & 24.4666666666667 \tabularnewline
52 & 26.03 \tabularnewline
53 & 35.8622727272727 \tabularnewline
54 & 37.8103896103896 \tabularnewline
55 & 54.0433333333334 \tabularnewline
56 & 78.456277056277 \tabularnewline
57 & 113.687857142857 \tabularnewline
58 & 205.008424908425 \tabularnewline
59 & 577.720622710623 \tabularnewline
\hline
\end{tabular}
%Source: https://freestatistics.org/blog/index.php?pk=23533&T=1

[TABLE]
[ROW][C]Summary of Dendrogram[/C][/ROW]
[ROW][C]Label[/C][C]Height[/C][/ROW]
[ROW][C]1[/C][C]0[/C][/ROW]
[ROW][C]2[/C][C]0.0999999999999943[/C][/ROW]
[ROW][C]3[/C][C]0.0999999999999943[/C][/ROW]
[ROW][C]4[/C][C]0.100000000000009[/C][/ROW]
[ROW][C]5[/C][C]0.100000000000009[/C][/ROW]
[ROW][C]6[/C][C]0.133333333333326[/C][/ROW]
[ROW][C]7[/C][C]0.166666666666657[/C][/ROW]
[ROW][C]8[/C][C]0.166666666666676[/C][/ROW]
[ROW][C]9[/C][C]0.200000000000003[/C][/ROW]
[ROW][C]10[/C][C]0.200000000000003[/C][/ROW]
[ROW][C]11[/C][C]0.200000000000003[/C][/ROW]
[ROW][C]12[/C][C]0.299999999999997[/C][/ROW]
[ROW][C]13[/C][C]0.299999999999997[/C][/ROW]
[ROW][C]14[/C][C]0.300000000000011[/C][/ROW]
[ROW][C]15[/C][C]0.316666666666691[/C][/ROW]
[ROW][C]16[/C][C]0.433333333333332[/C][/ROW]
[ROW][C]17[/C][C]0.466666666666664[/C][/ROW]
[ROW][C]18[/C][C]0.5[/C][/ROW]
[ROW][C]19[/C][C]0.5[/C][/ROW]
[ROW][C]20[/C][C]0.533333333333327[/C][/ROW]
[ROW][C]21[/C][C]0.599999999999994[/C][/ROW]
[ROW][C]22[/C][C]0.600000000000009[/C][/ROW]
[ROW][C]23[/C][C]0.600000000000023[/C][/ROW]
[ROW][C]24[/C][C]0.700000000000003[/C][/ROW]
[ROW][C]25[/C][C]0.76666666666667[/C][/ROW]
[ROW][C]26[/C][C]1[/C][/ROW]
[ROW][C]27[/C][C]1[/C][/ROW]
[ROW][C]28[/C][C]1[/C][/ROW]
[ROW][C]29[/C][C]1.13333333333333[/C][/ROW]
[ROW][C]30[/C][C]1.20000000000000[/C][/ROW]
[ROW][C]31[/C][C]1.26666666666667[/C][/ROW]
[ROW][C]32[/C][C]1.34999999999999[/C][/ROW]
[ROW][C]33[/C][C]1.79999999999999[/C][/ROW]
[ROW][C]34[/C][C]1.99999999999999[/C][/ROW]
[ROW][C]35[/C][C]2.38333333333332[/C][/ROW]
[ROW][C]36[/C][C]2.5[/C][/ROW]
[ROW][C]37[/C][C]2.86666666666666[/C][/ROW]
[ROW][C]38[/C][C]2.99999999999999[/C][/ROW]
[ROW][C]39[/C][C]3.1[/C][/ROW]
[ROW][C]40[/C][C]4.00000000000000[/C][/ROW]
[ROW][C]41[/C][C]4.59999999999999[/C][/ROW]
[ROW][C]42[/C][C]4.65476190476190[/C][/ROW]
[ROW][C]43[/C][C]5.39999999999998[/C][/ROW]
[ROW][C]44[/C][C]5.77333333333333[/C][/ROW]
[ROW][C]45[/C][C]7.24000000000001[/C][/ROW]
[ROW][C]46[/C][C]7.94999999999999[/C][/ROW]
[ROW][C]47[/C][C]9.84000000000004[/C][/ROW]
[ROW][C]48[/C][C]10.85[/C][/ROW]
[ROW][C]49[/C][C]13.4327272727273[/C][/ROW]
[ROW][C]50[/C][C]18.7333333333333[/C][/ROW]
[ROW][C]51[/C][C]24.4666666666667[/C][/ROW]
[ROW][C]52[/C][C]26.03[/C][/ROW]
[ROW][C]53[/C][C]35.8622727272727[/C][/ROW]
[ROW][C]54[/C][C]37.8103896103896[/C][/ROW]
[ROW][C]55[/C][C]54.0433333333334[/C][/ROW]
[ROW][C]56[/C][C]78.456277056277[/C][/ROW]
[ROW][C]57[/C][C]113.687857142857[/C][/ROW]
[ROW][C]58[/C][C]205.008424908425[/C][/ROW]
[ROW][C]59[/C][C]577.720622710623[/C][/ROW]
[/TABLE]
Source: https://freestatistics.org/blog/index.php?pk=23533&T=1

Globally Unique Identifier (entire table): ba.freestatistics.org/blog/index.php?pk=23533&T=1

As an alternative you can also use a QR Code:  

The GUIDs for individual cells are displayed in the table below:

Summary of Dendrogram
LabelHeight
10
20.0999999999999943
30.0999999999999943
40.100000000000009
50.100000000000009
60.133333333333326
70.166666666666657
80.166666666666676
90.200000000000003
100.200000000000003
110.200000000000003
120.299999999999997
130.299999999999997
140.300000000000011
150.316666666666691
160.433333333333332
170.466666666666664
180.5
190.5
200.533333333333327
210.599999999999994
220.600000000000009
230.600000000000023
240.700000000000003
250.76666666666667
261
271
281
291.13333333333333
301.20000000000000
311.26666666666667
321.34999999999999
331.79999999999999
341.99999999999999
352.38333333333332
362.5
372.86666666666666
382.99999999999999
393.1
404.00000000000000
414.59999999999999
424.65476190476190
435.39999999999998
445.77333333333333
457.24000000000001
467.94999999999999
479.84000000000004
4810.85
4913.4327272727273
5018.7333333333333
5124.4666666666667
5226.03
5335.8622727272727
5437.8103896103896
5554.0433333333334
5678.456277056277
57113.687857142857
58205.008424908425
59577.720622710623


Parameters (Session):
par1 = ward ; par2 = ALL ; par3 = FALSE ; par4 = FALSE ;
Parameters (R input):
par1 = ward ; par2 = ALL ; par3 = FALSE ; par4 = FALSE ;
R code (references can be found in the software module):
par3 <- as.logical(par3)
par4 <- as.logical(par4)
if (par3 == 'TRUE'){
dum = xlab
xlab = ylab
ylab = dum
}
x <- t(y)
hc <- hclust(dist(x),method=par1)
d <- as.dendrogram(hc)
str(d)
mysub <- paste('Method: ',par1)
bitmap(file='test1.png')
if (par4 == 'TRUE'){
plot(d,main=main,ylab=ylab,xlab=xlab,horiz=par3, nodePar=list(pch = c(1,NA), cex=0.8, lab.cex = 0.8),type='t',center=T, sub=mysub)
} else {
plot(d,main=main,ylab=ylab,xlab=xlab,horiz=par3, nodePar=list(pch = c(1,NA), cex=0.8, lab.cex = 0.8), sub=mysub)
}
dev.off()
if (par2 != 'ALL'){
if (par3 == 'TRUE'){
ylab = 'cluster'
} else {
xlab = 'cluster'
}
par2 <- as.numeric(par2)
memb <- cutree(hc, k = par2)
cent <- NULL
for(k in 1:par2){
cent <- rbind(cent, colMeans(x[memb == k, , drop = FALSE]))
}
hc1 <- hclust(dist(cent),method=par1, members = table(memb))
de <- as.dendrogram(hc1)
bitmap(file='test2.png')
if (par4 == 'TRUE'){
plot(de,main=main,ylab=ylab,xlab=xlab,horiz=par3, nodePar=list(pch = c(1,NA), cex=0.8, lab.cex = 0.8),type='t',center=T, sub=mysub)
} else {
plot(de,main=main,ylab=ylab,xlab=xlab,horiz=par3, nodePar=list(pch = c(1,NA), cex=0.8, lab.cex = 0.8), sub=mysub)
}
dev.off()
str(de)
}
load(file='createtable')
a<-table.start()
a<-table.row.start(a)
a<-table.element(a,'Summary of Dendrogram',2,TRUE)
a<-table.row.end(a)
a<-table.row.start(a)
a<-table.element(a,'Label',header=TRUE)
a<-table.element(a,'Height',header=TRUE)
a<-table.row.end(a)
num <- length(x[,1])-1
for (i in 1:num)
{
a<-table.row.start(a)
a<-table.element(a,hc$labels[i])
a<-table.element(a,hc$height[i])
a<-table.row.end(a)
}
a<-table.end(a)
table.save(a,file='mytable1.tab')
if (par2 != 'ALL'){
a<-table.start()
a<-table.row.start(a)
a<-table.element(a,'Summary of Cut Dendrogram',2,TRUE)
a<-table.row.end(a)
a<-table.row.start(a)
a<-table.element(a,'Label',header=TRUE)
a<-table.element(a,'Height',header=TRUE)
a<-table.row.end(a)
num <- par2-1
for (i in 1:num)
{
a<-table.row.start(a)
a<-table.element(a,i)
a<-table.element(a,hc1$height[i])
a<-table.row.end(a)
}
a<-table.end(a)
table.save(a,file='mytable2.tab')
}