Free Statistics

of Irreproducible Research!

Author's title

Author*The author of this computation has been verified*
R Software Modulerwasp_hierarchicalclustering.wasp
Title produced by softwareHierarchical Clustering
Date of computationTue, 11 Nov 2008 07:29:15 -0700
Cite this page as followsStatistical Computations at FreeStatistics.org, Office for Research Development and Education, URL https://freestatistics.org/blog/index.php?v=date/2008/Nov/11/t1226413793bjz3avxkb6xorea.htm/, Retrieved Sun, 19 May 2024 10:23:08 +0000
Statistical Computations at FreeStatistics.org, Office for Research Development and Education, URL https://freestatistics.org/blog/index.php?pk=23527, Retrieved Sun, 19 May 2024 10:23:08 +0000
QR Codes:

Original text written by user:
IsPrivate?No (this computation is public)
User-defined keywords
Estimated Impact131
Family? (F = Feedback message, R = changed R code, M = changed R Module, P = changed Parameters, D = changed Data)
-       [Hierarchical Clustering] [Q2-2] [2008-11-11 14:29:15] [541f63fa3157af9df10fc4d202b2a90b] [Current]
Feedback Forum

Post a new message
Dataseries X:
93,5
98,8
106,2
98,3
102,1
117,1
101,5
80,5
105,9
109,5
97,2
114,5
93,5
100,9
121,1
116,5
109,3
118,1
108,3
105,4
116,2
111,2
105,8
122,7
99,5
107,9
124,6
115
110,3
132,7
99,7
96,5
118,7
112,9
130,5
137,9
115
116,8
140,9
120,7
134,2
147,3
112,4
107,1
128,4
137,7
135
151
137,4
132,4
161,3
139,8
146
166,5
143,3
121
152,6
154,4
154,6
158


Summary of computational transaction
Raw Inputview raw input (R code)
Raw Outputview raw output of R engine
Computing time2 seconds
R Server'George Udny Yule' @ 72.249.76.132

\begin{tabular}{lllllllll}
\hline
Summary of computational transaction \tabularnewline
Raw Input & view raw input (R code)  \tabularnewline
Raw Output & view raw output of R engine  \tabularnewline
Computing time & 2 seconds \tabularnewline
R Server & 'George Udny Yule' @ 72.249.76.132 \tabularnewline
\hline
\end{tabular}
%Source: https://freestatistics.org/blog/index.php?pk=23527&T=0

[TABLE]
[ROW][C]Summary of computational transaction[/C][/ROW]
[ROW][C]Raw Input[/C][C]view raw input (R code) [/C][/ROW]
[ROW][C]Raw Output[/C][C]view raw output of R engine [/C][/ROW]
[ROW][C]Computing time[/C][C]2 seconds[/C][/ROW]
[ROW][C]R Server[/C][C]'George Udny Yule' @ 72.249.76.132[/C][/ROW]
[/TABLE]
Source: https://freestatistics.org/blog/index.php?pk=23527&T=0

Globally Unique Identifier (entire table): ba.freestatistics.org/blog/index.php?pk=23527&T=0

As an alternative you can also use a QR Code:  

The GUIDs for individual cells are displayed in the table below:

Summary of computational transaction
Raw Inputview raw input (R code)
Raw Outputview raw output of R engine
Computing time2 seconds
R Server'George Udny Yule' @ 72.249.76.132


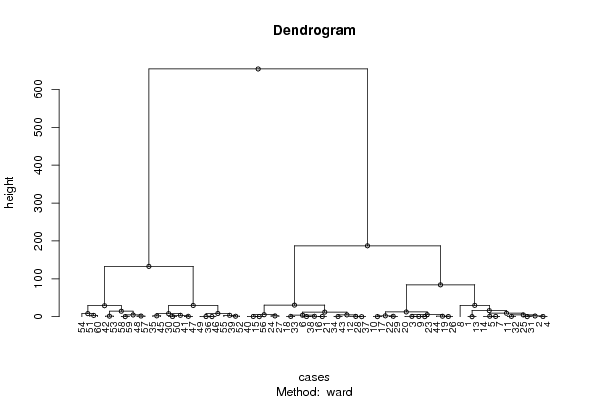
Summary of Dendrogram
LabelHeight
10
20
30.0999999999999943
40.100000000000009
50.199999999999989
60.200000000000003
70.200000000000003
80.200000000000017
90.299999999999983
100.299999999999997
110.299999999999997
120.399999999999991
130.433333333333328
140.433333333333332
150.46666666666665
160.5
170.5
180.599999999999994
190.600000000000009
200.666666666666667
210.700000000000003
220.71666666666666
230.800000000000011
240.899999999999991
250.900000000000006
260.99999999999999
271.09999999999999
281.20000000000001
291.30000000000001
301.59999999999999
311.75000000000001
321.89999999999999
332.09999999999999
342.15
353.30000000000001
363.55
373.56666666666667
383.76666666666667
394.50000000000001
404.64999999999999
414.67333333333332
425.16666666666668
435.20714285714284
448.03333333333332
458.04999999999999
468.33333333333336
479
4812.0024242424242
4912.4019480519480
5014.3666666666666
5115.9272727272727
5228.9222222222222
5329.5666666666667
5429.8060606060606
5530.5034090909091
5683.9836627140975
57132.773015873016
58187.079361761427
59654.210146520147

\begin{tabular}{lllllllll}
\hline
Summary of Dendrogram \tabularnewline
Label & Height \tabularnewline
1 & 0 \tabularnewline
2 & 0 \tabularnewline
3 & 0.0999999999999943 \tabularnewline
4 & 0.100000000000009 \tabularnewline
5 & 0.199999999999989 \tabularnewline
6 & 0.200000000000003 \tabularnewline
7 & 0.200000000000003 \tabularnewline
8 & 0.200000000000017 \tabularnewline
9 & 0.299999999999983 \tabularnewline
10 & 0.299999999999997 \tabularnewline
11 & 0.299999999999997 \tabularnewline
12 & 0.399999999999991 \tabularnewline
13 & 0.433333333333328 \tabularnewline
14 & 0.433333333333332 \tabularnewline
15 & 0.46666666666665 \tabularnewline
16 & 0.5 \tabularnewline
17 & 0.5 \tabularnewline
18 & 0.599999999999994 \tabularnewline
19 & 0.600000000000009 \tabularnewline
20 & 0.666666666666667 \tabularnewline
21 & 0.700000000000003 \tabularnewline
22 & 0.71666666666666 \tabularnewline
23 & 0.800000000000011 \tabularnewline
24 & 0.899999999999991 \tabularnewline
25 & 0.900000000000006 \tabularnewline
26 & 0.99999999999999 \tabularnewline
27 & 1.09999999999999 \tabularnewline
28 & 1.20000000000001 \tabularnewline
29 & 1.30000000000001 \tabularnewline
30 & 1.59999999999999 \tabularnewline
31 & 1.75000000000001 \tabularnewline
32 & 1.89999999999999 \tabularnewline
33 & 2.09999999999999 \tabularnewline
34 & 2.15 \tabularnewline
35 & 3.30000000000001 \tabularnewline
36 & 3.55 \tabularnewline
37 & 3.56666666666667 \tabularnewline
38 & 3.76666666666667 \tabularnewline
39 & 4.50000000000001 \tabularnewline
40 & 4.64999999999999 \tabularnewline
41 & 4.67333333333332 \tabularnewline
42 & 5.16666666666668 \tabularnewline
43 & 5.20714285714284 \tabularnewline
44 & 8.03333333333332 \tabularnewline
45 & 8.04999999999999 \tabularnewline
46 & 8.33333333333336 \tabularnewline
47 & 9 \tabularnewline
48 & 12.0024242424242 \tabularnewline
49 & 12.4019480519480 \tabularnewline
50 & 14.3666666666666 \tabularnewline
51 & 15.9272727272727 \tabularnewline
52 & 28.9222222222222 \tabularnewline
53 & 29.5666666666667 \tabularnewline
54 & 29.8060606060606 \tabularnewline
55 & 30.5034090909091 \tabularnewline
56 & 83.9836627140975 \tabularnewline
57 & 132.773015873016 \tabularnewline
58 & 187.079361761427 \tabularnewline
59 & 654.210146520147 \tabularnewline
\hline
\end{tabular}
%Source: https://freestatistics.org/blog/index.php?pk=23527&T=1

[TABLE]
[ROW][C]Summary of Dendrogram[/C][/ROW]
[ROW][C]Label[/C][C]Height[/C][/ROW]
[ROW][C]1[/C][C]0[/C][/ROW]
[ROW][C]2[/C][C]0[/C][/ROW]
[ROW][C]3[/C][C]0.0999999999999943[/C][/ROW]
[ROW][C]4[/C][C]0.100000000000009[/C][/ROW]
[ROW][C]5[/C][C]0.199999999999989[/C][/ROW]
[ROW][C]6[/C][C]0.200000000000003[/C][/ROW]
[ROW][C]7[/C][C]0.200000000000003[/C][/ROW]
[ROW][C]8[/C][C]0.200000000000017[/C][/ROW]
[ROW][C]9[/C][C]0.299999999999983[/C][/ROW]
[ROW][C]10[/C][C]0.299999999999997[/C][/ROW]
[ROW][C]11[/C][C]0.299999999999997[/C][/ROW]
[ROW][C]12[/C][C]0.399999999999991[/C][/ROW]
[ROW][C]13[/C][C]0.433333333333328[/C][/ROW]
[ROW][C]14[/C][C]0.433333333333332[/C][/ROW]
[ROW][C]15[/C][C]0.46666666666665[/C][/ROW]
[ROW][C]16[/C][C]0.5[/C][/ROW]
[ROW][C]17[/C][C]0.5[/C][/ROW]
[ROW][C]18[/C][C]0.599999999999994[/C][/ROW]
[ROW][C]19[/C][C]0.600000000000009[/C][/ROW]
[ROW][C]20[/C][C]0.666666666666667[/C][/ROW]
[ROW][C]21[/C][C]0.700000000000003[/C][/ROW]
[ROW][C]22[/C][C]0.71666666666666[/C][/ROW]
[ROW][C]23[/C][C]0.800000000000011[/C][/ROW]
[ROW][C]24[/C][C]0.899999999999991[/C][/ROW]
[ROW][C]25[/C][C]0.900000000000006[/C][/ROW]
[ROW][C]26[/C][C]0.99999999999999[/C][/ROW]
[ROW][C]27[/C][C]1.09999999999999[/C][/ROW]
[ROW][C]28[/C][C]1.20000000000001[/C][/ROW]
[ROW][C]29[/C][C]1.30000000000001[/C][/ROW]
[ROW][C]30[/C][C]1.59999999999999[/C][/ROW]
[ROW][C]31[/C][C]1.75000000000001[/C][/ROW]
[ROW][C]32[/C][C]1.89999999999999[/C][/ROW]
[ROW][C]33[/C][C]2.09999999999999[/C][/ROW]
[ROW][C]34[/C][C]2.15[/C][/ROW]
[ROW][C]35[/C][C]3.30000000000001[/C][/ROW]
[ROW][C]36[/C][C]3.55[/C][/ROW]
[ROW][C]37[/C][C]3.56666666666667[/C][/ROW]
[ROW][C]38[/C][C]3.76666666666667[/C][/ROW]
[ROW][C]39[/C][C]4.50000000000001[/C][/ROW]
[ROW][C]40[/C][C]4.64999999999999[/C][/ROW]
[ROW][C]41[/C][C]4.67333333333332[/C][/ROW]
[ROW][C]42[/C][C]5.16666666666668[/C][/ROW]
[ROW][C]43[/C][C]5.20714285714284[/C][/ROW]
[ROW][C]44[/C][C]8.03333333333332[/C][/ROW]
[ROW][C]45[/C][C]8.04999999999999[/C][/ROW]
[ROW][C]46[/C][C]8.33333333333336[/C][/ROW]
[ROW][C]47[/C][C]9[/C][/ROW]
[ROW][C]48[/C][C]12.0024242424242[/C][/ROW]
[ROW][C]49[/C][C]12.4019480519480[/C][/ROW]
[ROW][C]50[/C][C]14.3666666666666[/C][/ROW]
[ROW][C]51[/C][C]15.9272727272727[/C][/ROW]
[ROW][C]52[/C][C]28.9222222222222[/C][/ROW]
[ROW][C]53[/C][C]29.5666666666667[/C][/ROW]
[ROW][C]54[/C][C]29.8060606060606[/C][/ROW]
[ROW][C]55[/C][C]30.5034090909091[/C][/ROW]
[ROW][C]56[/C][C]83.9836627140975[/C][/ROW]
[ROW][C]57[/C][C]132.773015873016[/C][/ROW]
[ROW][C]58[/C][C]187.079361761427[/C][/ROW]
[ROW][C]59[/C][C]654.210146520147[/C][/ROW]
[/TABLE]
Source: https://freestatistics.org/blog/index.php?pk=23527&T=1

Globally Unique Identifier (entire table): ba.freestatistics.org/blog/index.php?pk=23527&T=1

As an alternative you can also use a QR Code:  

The GUIDs for individual cells are displayed in the table below:

Summary of Dendrogram
LabelHeight
10
20
30.0999999999999943
40.100000000000009
50.199999999999989
60.200000000000003
70.200000000000003
80.200000000000017
90.299999999999983
100.299999999999997
110.299999999999997
120.399999999999991
130.433333333333328
140.433333333333332
150.46666666666665
160.5
170.5
180.599999999999994
190.600000000000009
200.666666666666667
210.700000000000003
220.71666666666666
230.800000000000011
240.899999999999991
250.900000000000006
260.99999999999999
271.09999999999999
281.20000000000001
291.30000000000001
301.59999999999999
311.75000000000001
321.89999999999999
332.09999999999999
342.15
353.30000000000001
363.55
373.56666666666667
383.76666666666667
394.50000000000001
404.64999999999999
414.67333333333332
425.16666666666668
435.20714285714284
448.03333333333332
458.04999999999999
468.33333333333336
479
4812.0024242424242
4912.4019480519480
5014.3666666666666
5115.9272727272727
5228.9222222222222
5329.5666666666667
5429.8060606060606
5530.5034090909091
5683.9836627140975
57132.773015873016
58187.079361761427
59654.210146520147


Parameters (Session):
par1 = ward ; par2 = ALL ; par3 = FALSE ; par4 = FALSE ;
Parameters (R input):
par1 = ward ; par2 = ALL ; par3 = FALSE ; par4 = FALSE ;
R code (references can be found in the software module):
par3 <- as.logical(par3)
par4 <- as.logical(par4)
if (par3 == 'TRUE'){
dum = xlab
xlab = ylab
ylab = dum
}
x <- t(y)
hc <- hclust(dist(x),method=par1)
d <- as.dendrogram(hc)
str(d)
mysub <- paste('Method: ',par1)
bitmap(file='test1.png')
if (par4 == 'TRUE'){
plot(d,main=main,ylab=ylab,xlab=xlab,horiz=par3, nodePar=list(pch = c(1,NA), cex=0.8, lab.cex = 0.8),type='t',center=T, sub=mysub)
} else {
plot(d,main=main,ylab=ylab,xlab=xlab,horiz=par3, nodePar=list(pch = c(1,NA), cex=0.8, lab.cex = 0.8), sub=mysub)
}
dev.off()
if (par2 != 'ALL'){
if (par3 == 'TRUE'){
ylab = 'cluster'
} else {
xlab = 'cluster'
}
par2 <- as.numeric(par2)
memb <- cutree(hc, k = par2)
cent <- NULL
for(k in 1:par2){
cent <- rbind(cent, colMeans(x[memb == k, , drop = FALSE]))
}
hc1 <- hclust(dist(cent),method=par1, members = table(memb))
de <- as.dendrogram(hc1)
bitmap(file='test2.png')
if (par4 == 'TRUE'){
plot(de,main=main,ylab=ylab,xlab=xlab,horiz=par3, nodePar=list(pch = c(1,NA), cex=0.8, lab.cex = 0.8),type='t',center=T, sub=mysub)
} else {
plot(de,main=main,ylab=ylab,xlab=xlab,horiz=par3, nodePar=list(pch = c(1,NA), cex=0.8, lab.cex = 0.8), sub=mysub)
}
dev.off()
str(de)
}
load(file='createtable')
a<-table.start()
a<-table.row.start(a)
a<-table.element(a,'Summary of Dendrogram',2,TRUE)
a<-table.row.end(a)
a<-table.row.start(a)
a<-table.element(a,'Label',header=TRUE)
a<-table.element(a,'Height',header=TRUE)
a<-table.row.end(a)
num <- length(x[,1])-1
for (i in 1:num)
{
a<-table.row.start(a)
a<-table.element(a,hc$labels[i])
a<-table.element(a,hc$height[i])
a<-table.row.end(a)
}
a<-table.end(a)
table.save(a,file='mytable1.tab')
if (par2 != 'ALL'){
a<-table.start()
a<-table.row.start(a)
a<-table.element(a,'Summary of Cut Dendrogram',2,TRUE)
a<-table.row.end(a)
a<-table.row.start(a)
a<-table.element(a,'Label',header=TRUE)
a<-table.element(a,'Height',header=TRUE)
a<-table.row.end(a)
num <- par2-1
for (i in 1:num)
{
a<-table.row.start(a)
a<-table.element(a,i)
a<-table.element(a,hc1$height[i])
a<-table.row.end(a)
}
a<-table.end(a)
table.save(a,file='mytable2.tab')
}