Free Statistics

of Irreproducible Research!

Author's title

Author*Unverified author*
R Software Modulerwasp_hierarchicalclustering.wasp
Title produced by softwareHierarchical Clustering
Date of computationTue, 11 Nov 2008 07:17:55 -0700
Cite this page as followsStatistical Computations at FreeStatistics.org, Office for Research Development and Education, URL https://freestatistics.org/blog/index.php?v=date/2008/Nov/11/t1226413497gdpt4hhi2lvvvci.htm/, Retrieved Sun, 19 May 2024 12:02:45 +0000
Statistical Computations at FreeStatistics.org, Office for Research Development and Education, URL https://freestatistics.org/blog/index.php?pk=23519, Retrieved Sun, 19 May 2024 12:02:45 +0000
QR Codes:

Original text written by user:
IsPrivate?No (this computation is public)
User-defined keywords
Estimated Impact118
Family? (F = Feedback message, R = changed R code, M = changed R Module, P = changed Parameters, D = changed Data)
-       [Hierarchical Clustering] [Stefan Temmerman] [2008-11-11 14:17:55] [7866e091edc3e3e9f6a037e9d19fcaa2] [Current]
Feedback Forum

Post a new message
Dataseries X:
-13		-7		-3
-32		18		-7
-36		9		15
-22		-8		-19
2		-5		6
-10		6		2
-21		13		-16
-1		0		-14
-20		9		14
0		8		-5
19		-4		-12
-14		12		8
-49		1		18
-30		15		12
-14		13		-3
-12		-17		4
5		-3		8
0		15		-25
-14		16		20
-4		-21		12
-11		5		3
-9		-4		18
-6		-4		3
-13		-2		19
-29		-12		13
-31		-8		25
-37		-9		16
-33		-15		-5
-26		-15		12
-21		-5		18
-27		-31		-16
-29		-23		-21
-31		-25		-16
-13		-40		-8
4		-33		-25
-18		-26		-24
-21		-43		0


Summary of computational transaction
Raw Inputview raw input (R code)
Raw Outputview raw output of R engine
Computing time1 seconds
R Server'George Udny Yule' @ 72.249.76.132
R Framework error message
Warning: there are blank lines in the 'Data X' field.
Please, use NA for missing data - blank lines are simply
 deleted and are NOT treated as missing values.

\begin{tabular}{lllllllll}
\hline
Summary of computational transaction \tabularnewline
Raw Input & view raw input (R code)  \tabularnewline
Raw Output & view raw output of R engine  \tabularnewline
Computing time & 1 seconds \tabularnewline
R Server & 'George Udny Yule' @ 72.249.76.132 \tabularnewline
R Framework error message & 
Warning: there are blank lines in the 'Data X' field.
Please, use NA for missing data - blank lines are simply
 deleted and are NOT treated as missing values.
\tabularnewline \hline \end{tabular} %Source: https://freestatistics.org/blog/index.php?pk=23519&T=0

[TABLE]
[ROW][C]Summary of computational transaction[/C][/ROW]
[ROW][C]Raw Input[/C][C]view raw input (R code) [/C][/ROW]
[ROW][C]Raw Output[/C][C]view raw output of R engine [/C][/ROW]
[ROW][C]Computing time[/C][C]1 seconds[/C][/ROW]
[ROW][C]R Server[/C][C]'George Udny Yule' @ 72.249.76.132[/C][/ROW]
[ROW][C]R Framework error message[/C][C]
Warning: there are blank lines in the 'Data X' field.
Please, use NA for missing data - blank lines are simply
 deleted and are NOT treated as missing values.
[/C][/ROW] [/TABLE] Source: https://freestatistics.org/blog/index.php?pk=23519&T=0

Globally Unique Identifier (entire table): ba.freestatistics.org/blog/index.php?pk=23519&T=0

As an alternative you can also use a QR Code:  

The GUIDs for individual cells are displayed in the table below:

Summary of computational transaction
Raw Inputview raw input (R code)
Raw Outputview raw output of R engine
Computing time1 seconds
R Server'George Udny Yule' @ 72.249.76.132
R Framework error message
Warning: there are blank lines in the 'Data X' field.
Please, use NA for missing data - blank lines are simply
 deleted and are NOT treated as missing values.


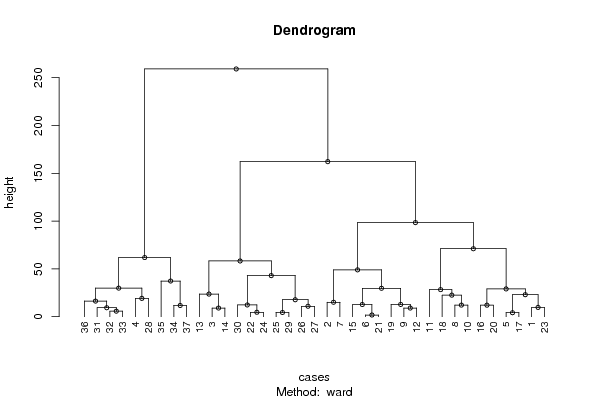
Summary of Dendrogram
LabelHeight
11.73205080756888
24.12310562561766
34.35889894354067
44.58257569495584
55.74456264653803
69
79
89.32164799243461
99.69535971483266
1010.8627804912002
1111.7046999107196
1212
1312.0830459735946
1412.2350879989047
1512.7074093904208
1612.7660737604490
1715.0665191733194
1816.2960920771245
1917.6906789421740
2019.131126469709
2122.5173554158780
2222.9929714974087
2323.6052936732506
2428.2902642711306
2529.0308230534116
2629.6686002450360
2729.8638229007478
2837.2866428249905
2942.9547076273871
3048.9529992922973
3158.2532578523373
3261.8332637859006
3371.068901440611
3498.4236149345468
35162.203522201123
36259.171806149557

\begin{tabular}{lllllllll}
\hline
Summary of Dendrogram \tabularnewline
Label & Height \tabularnewline
1 & 1.73205080756888 \tabularnewline
2 & 4.12310562561766 \tabularnewline
3 & 4.35889894354067 \tabularnewline
4 & 4.58257569495584 \tabularnewline
5 & 5.74456264653803 \tabularnewline
6 & 9 \tabularnewline
7 & 9 \tabularnewline
8 & 9.32164799243461 \tabularnewline
9 & 9.69535971483266 \tabularnewline
10 & 10.8627804912002 \tabularnewline
11 & 11.7046999107196 \tabularnewline
12 & 12 \tabularnewline
13 & 12.0830459735946 \tabularnewline
14 & 12.2350879989047 \tabularnewline
15 & 12.7074093904208 \tabularnewline
16 & 12.7660737604490 \tabularnewline
17 & 15.0665191733194 \tabularnewline
18 & 16.2960920771245 \tabularnewline
19 & 17.6906789421740 \tabularnewline
20 & 19.131126469709 \tabularnewline
21 & 22.5173554158780 \tabularnewline
22 & 22.9929714974087 \tabularnewline
23 & 23.6052936732506 \tabularnewline
24 & 28.2902642711306 \tabularnewline
25 & 29.0308230534116 \tabularnewline
26 & 29.6686002450360 \tabularnewline
27 & 29.8638229007478 \tabularnewline
28 & 37.2866428249905 \tabularnewline
29 & 42.9547076273871 \tabularnewline
30 & 48.9529992922973 \tabularnewline
31 & 58.2532578523373 \tabularnewline
32 & 61.8332637859006 \tabularnewline
33 & 71.068901440611 \tabularnewline
34 & 98.4236149345468 \tabularnewline
35 & 162.203522201123 \tabularnewline
36 & 259.171806149557 \tabularnewline
\hline
\end{tabular}
%Source: https://freestatistics.org/blog/index.php?pk=23519&T=1

[TABLE]
[ROW][C]Summary of Dendrogram[/C][/ROW]
[ROW][C]Label[/C][C]Height[/C][/ROW]
[ROW][C]1[/C][C]1.73205080756888[/C][/ROW]
[ROW][C]2[/C][C]4.12310562561766[/C][/ROW]
[ROW][C]3[/C][C]4.35889894354067[/C][/ROW]
[ROW][C]4[/C][C]4.58257569495584[/C][/ROW]
[ROW][C]5[/C][C]5.74456264653803[/C][/ROW]
[ROW][C]6[/C][C]9[/C][/ROW]
[ROW][C]7[/C][C]9[/C][/ROW]
[ROW][C]8[/C][C]9.32164799243461[/C][/ROW]
[ROW][C]9[/C][C]9.69535971483266[/C][/ROW]
[ROW][C]10[/C][C]10.8627804912002[/C][/ROW]
[ROW][C]11[/C][C]11.7046999107196[/C][/ROW]
[ROW][C]12[/C][C]12[/C][/ROW]
[ROW][C]13[/C][C]12.0830459735946[/C][/ROW]
[ROW][C]14[/C][C]12.2350879989047[/C][/ROW]
[ROW][C]15[/C][C]12.7074093904208[/C][/ROW]
[ROW][C]16[/C][C]12.7660737604490[/C][/ROW]
[ROW][C]17[/C][C]15.0665191733194[/C][/ROW]
[ROW][C]18[/C][C]16.2960920771245[/C][/ROW]
[ROW][C]19[/C][C]17.6906789421740[/C][/ROW]
[ROW][C]20[/C][C]19.131126469709[/C][/ROW]
[ROW][C]21[/C][C]22.5173554158780[/C][/ROW]
[ROW][C]22[/C][C]22.9929714974087[/C][/ROW]
[ROW][C]23[/C][C]23.6052936732506[/C][/ROW]
[ROW][C]24[/C][C]28.2902642711306[/C][/ROW]
[ROW][C]25[/C][C]29.0308230534116[/C][/ROW]
[ROW][C]26[/C][C]29.6686002450360[/C][/ROW]
[ROW][C]27[/C][C]29.8638229007478[/C][/ROW]
[ROW][C]28[/C][C]37.2866428249905[/C][/ROW]
[ROW][C]29[/C][C]42.9547076273871[/C][/ROW]
[ROW][C]30[/C][C]48.9529992922973[/C][/ROW]
[ROW][C]31[/C][C]58.2532578523373[/C][/ROW]
[ROW][C]32[/C][C]61.8332637859006[/C][/ROW]
[ROW][C]33[/C][C]71.068901440611[/C][/ROW]
[ROW][C]34[/C][C]98.4236149345468[/C][/ROW]
[ROW][C]35[/C][C]162.203522201123[/C][/ROW]
[ROW][C]36[/C][C]259.171806149557[/C][/ROW]
[/TABLE]
Source: https://freestatistics.org/blog/index.php?pk=23519&T=1

Globally Unique Identifier (entire table): ba.freestatistics.org/blog/index.php?pk=23519&T=1

As an alternative you can also use a QR Code:  

The GUIDs for individual cells are displayed in the table below:

Summary of Dendrogram
LabelHeight
11.73205080756888
24.12310562561766
34.35889894354067
44.58257569495584
55.74456264653803
69
79
89.32164799243461
99.69535971483266
1010.8627804912002
1111.7046999107196
1212
1312.0830459735946
1412.2350879989047
1512.7074093904208
1612.7660737604490
1715.0665191733194
1816.2960920771245
1917.6906789421740
2019.131126469709
2122.5173554158780
2222.9929714974087
2323.6052936732506
2428.2902642711306
2529.0308230534116
2629.6686002450360
2729.8638229007478
2837.2866428249905
2942.9547076273871
3048.9529992922973
3158.2532578523373
3261.8332637859006
3371.068901440611
3498.4236149345468
35162.203522201123
36259.171806149557


Parameters (Session):
par1 = ward ; par2 = ALL ; par3 = FALSE ; par4 = FALSE ;
Parameters (R input):
par1 = ward ; par2 = ALL ; par3 = FALSE ; par4 = FALSE ;
R code (references can be found in the software module):
par3 <- as.logical(par3)
par4 <- as.logical(par4)
if (par3 == 'TRUE'){
dum = xlab
xlab = ylab
ylab = dum
}
x <- t(y)
hc <- hclust(dist(x),method=par1)
d <- as.dendrogram(hc)
str(d)
mysub <- paste('Method: ',par1)
bitmap(file='test1.png')
if (par4 == 'TRUE'){
plot(d,main=main,ylab=ylab,xlab=xlab,horiz=par3, nodePar=list(pch = c(1,NA), cex=0.8, lab.cex = 0.8),type='t',center=T, sub=mysub)
} else {
plot(d,main=main,ylab=ylab,xlab=xlab,horiz=par3, nodePar=list(pch = c(1,NA), cex=0.8, lab.cex = 0.8), sub=mysub)
}
dev.off()
if (par2 != 'ALL'){
if (par3 == 'TRUE'){
ylab = 'cluster'
} else {
xlab = 'cluster'
}
par2 <- as.numeric(par2)
memb <- cutree(hc, k = par2)
cent <- NULL
for(k in 1:par2){
cent <- rbind(cent, colMeans(x[memb == k, , drop = FALSE]))
}
hc1 <- hclust(dist(cent),method=par1, members = table(memb))
de <- as.dendrogram(hc1)
bitmap(file='test2.png')
if (par4 == 'TRUE'){
plot(de,main=main,ylab=ylab,xlab=xlab,horiz=par3, nodePar=list(pch = c(1,NA), cex=0.8, lab.cex = 0.8),type='t',center=T, sub=mysub)
} else {
plot(de,main=main,ylab=ylab,xlab=xlab,horiz=par3, nodePar=list(pch = c(1,NA), cex=0.8, lab.cex = 0.8), sub=mysub)
}
dev.off()
str(de)
}
load(file='createtable')
a<-table.start()
a<-table.row.start(a)
a<-table.element(a,'Summary of Dendrogram',2,TRUE)
a<-table.row.end(a)
a<-table.row.start(a)
a<-table.element(a,'Label',header=TRUE)
a<-table.element(a,'Height',header=TRUE)
a<-table.row.end(a)
num <- length(x[,1])-1
for (i in 1:num)
{
a<-table.row.start(a)
a<-table.element(a,hc$labels[i])
a<-table.element(a,hc$height[i])
a<-table.row.end(a)
}
a<-table.end(a)
table.save(a,file='mytable1.tab')
if (par2 != 'ALL'){
a<-table.start()
a<-table.row.start(a)
a<-table.element(a,'Summary of Cut Dendrogram',2,TRUE)
a<-table.row.end(a)
a<-table.row.start(a)
a<-table.element(a,'Label',header=TRUE)
a<-table.element(a,'Height',header=TRUE)
a<-table.row.end(a)
num <- par2-1
for (i in 1:num)
{
a<-table.row.start(a)
a<-table.element(a,i)
a<-table.element(a,hc1$height[i])
a<-table.row.end(a)
}
a<-table.end(a)
table.save(a,file='mytable2.tab')
}