Free Statistics

of Irreproducible Research!

Author's title

Author*The author of this computation has been verified*
R Software Modulerwasp_hierarchicalclustering.wasp
Title produced by softwareHierarchical Clustering
Date of computationTue, 11 Nov 2008 07:17:41 -0700
Cite this page as followsStatistical Computations at FreeStatistics.org, Office for Research Development and Education, URL https://freestatistics.org/blog/index.php?v=date/2008/Nov/11/t12264132108xeurmo8esbsr9m.htm/, Retrieved Sun, 19 May 2024 10:46:50 +0000
Statistical Computations at FreeStatistics.org, Office for Research Development and Education, URL https://freestatistics.org/blog/index.php?pk=23508, Retrieved Sun, 19 May 2024 10:46:50 +0000
QR Codes:

Original text written by user:
IsPrivate?No (this computation is public)
User-defined keywords
Estimated Impact164
Family? (F = Feedback message, R = changed R code, M = changed R Module, P = changed Parameters, D = changed Data)
F     [Notched Boxplots] [workshop 3] [2007-10-26 13:31:48] [e9ffc5de6f8a7be62f22b142b5b6b1a8]
F    D  [Notched Boxplots] [Q1 - Notched Boxplot] [2008-11-03 09:57:32] [a7f04e0e73ce3683561193958d653479]
F RMPD    [Bivariate Kernel Density Estimation] [Various EDA topic...] [2008-11-11 13:04:27] [a7f04e0e73ce3683561193958d653479]
F RMPD        [Hierarchical Clustering] [Various EDA topic...] [2008-11-11 14:17:41] [f1a30f1149cef3ef3ef69d586c6c3c1c] [Current]
Feedback Forum
2008-11-20 09:38:42 [An De Koninck] [reply
Ook hier heeft de student geen conclusies getrokken.
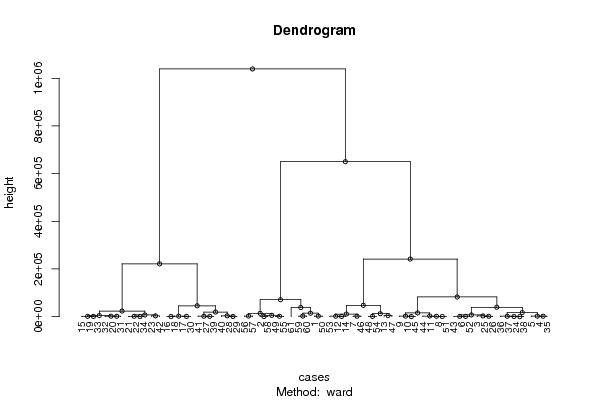
Deze grafiek geeft een overzicht van alle resultaten en deze worden dan 'geclusterd', wat wil zeggen dat alle obersevaties die ongeveer dezelfde uitkomst hebben, bij elkaar genomen worden.
Je ziet dus eerst al 2 uiteenlopende takken, wat wil zeggen dat de observaties totaal verschillend waren.
Aan de linkerkant zie je dan dat deze tak zich nog eens 2 keer vertakt, wat weer wijst op verschillende resultaten binnen het eerst uitgekomen resultaat. Op hun beurt vertakken deze neventakken zich nog eens.
Aan de rechterkant doet zich hetzelfde fenomeen voor, maar wordt er nog meer uitgesplitst.
Deze twee grote takken zouden kunnen wijzen op verschillende periodes. Bv een periode waarin er een slechte ecnomische situatie is, waar er dus veel werkloosheid is, weinig gespaard wordt door de gezinnen en weinig woningen worden gebouwd, en een andere periode waarin de economische situatie net goed draait en waar er dan misschien weinig werkloosheid is, meer gespaard wordt en waar er meer woningen worden gebouwd.
Binnen deze 2 periodes heb je dan ook nog momenten waar het beter en minder gaat.

Post a new message
Dataseries X:
19	10	500857	3431
14	12	506971	3874
11	12	569323	2617
13	13	579714	3580
21	17	577992	5267
10	12	565464	3832
23	15	547344	3441
23	12	554788	3228
27	14	562325	3397
30	19	560854	3971
28	16	555332	4625
25	17	543599	4486
21	16	536662	4131
29	19	542722	4686
20	17	593530	3174
24	17	610763	4282
23	20	612613	4209
16	18	611324	4159
17	16	594167	3936
19	19	595454	3153
19	18	590865	3620
21	23	589379	4227
25	20	584428	4441
18	20	573100	4808
8	15	567456	4850
7	17	569028	5040
5	16	620735	3546
10	15	628884	4669
0	10	628232	5410
13	13	612117	5134
13	10	595404	4864
17	19	597141	3999
20	21	593408	4459
19	17	590072	4622
16	16	579799	5360
16	17	574205	4658
16	14	572775	5173
20	18	572942	4845
23	17	619567	3325
18	14	625809	4720
20	15	619916	4895
26	16	587625	5071
25	11	565742	4895
16	15	557274	3805
22	13	560576	4187
23	17	548854	4435
20	16	531673	4475
27	9	525919	4774
25	17	511038	5161
26	15	498662	4529
23	12	555362	3284
13	12	564591	4303
13	12	541657	4610
14	12	527070	4691
1	4	509846	4200
7	7	514258	3471
5	4	516922	3132
9	3	507561	4226
11	3	492622	3723
6	0	490243	3576
0	5	469357	3397


Summary of computational transaction
Raw Inputview raw input (R code)
Raw Outputview raw output of R engine
Computing time4 seconds
R Server'Sir Ronald Aylmer Fisher' @ 193.190.124.24

\begin{tabular}{lllllllll}
\hline
Summary of computational transaction \tabularnewline
Raw Input & view raw input (R code)  \tabularnewline
Raw Output & view raw output of R engine  \tabularnewline
Computing time & 4 seconds \tabularnewline
R Server & 'Sir Ronald Aylmer Fisher' @ 193.190.124.24 \tabularnewline
\hline
\end{tabular}
%Source: https://freestatistics.org/blog/index.php?pk=23508&T=0

[TABLE]
[ROW][C]Summary of computational transaction[/C][/ROW]
[ROW][C]Raw Input[/C][C]view raw input (R code) [/C][/ROW]
[ROW][C]Raw Output[/C][C]view raw output of R engine [/C][/ROW]
[ROW][C]Computing time[/C][C]4 seconds[/C][/ROW]
[ROW][C]R Server[/C][C]'Sir Ronald Aylmer Fisher' @ 193.190.124.24[/C][/ROW]
[/TABLE]
Source: https://freestatistics.org/blog/index.php?pk=23508&T=0

Globally Unique Identifier (entire table): ba.freestatistics.org/blog/index.php?pk=23508&T=0

As an alternative you can also use a QR Code:  

The GUIDs for individual cells are displayed in the table below:

Summary of computational transaction
Raw Inputview raw input (R code)
Raw Outputview raw output of R engine
Computing time4 seconds
R Server'Sir Ronald Aylmer Fisher' @ 193.190.124.24


Summary of Dendrogram
LabelHeight
1162.299106590271
2352.193128837006
3517.149487473929
4574.382276885351
5576.725237873287
6687.102612424083
7797.6929233734
8899.527097979822
9921.76135740223
10987.071425986995
11991.957156332873
121049.66185031180
131154.06585600649
141188.86079925280
151215.39484450863
161264.83414195639
171531.38172902774
181583.44213661251
191656.12497571994
201701.45554008891
211709.39051044378
221711.76458661815
231728.07940745406
241782.03338913725
251786.05189254132
261807.7997676734
271981.23251604139
282186.98602122778
292214.72382289698
302219.36850279006
312383.54441955672
322454.32332833309
332685.48505860673
342751.39442265342
353039.89914608524
363258.48523090101
373400.86419448281
384553.08170992789
395000.84572847433
405413.26029045633
417093.83625638218
427137.27342430782
4311100.6533915921
4412292.7485138658
4513975.6100894354
4614291.8457596770
4715579.2933443598
4817127.17108901
4919374.0716627875
5023471.3359332478
5138166.4365890079
5239431.507023291
5345548.2852153164
5447364.3304340991
5571004.9194482464
5682515.4041534364
57221440.723909685
58241733.336558712
59650126.939935581
601039084.96545092

\begin{tabular}{lllllllll}
\hline
Summary of Dendrogram \tabularnewline
Label & Height \tabularnewline
1 & 162.299106590271 \tabularnewline
2 & 352.193128837006 \tabularnewline
3 & 517.149487473929 \tabularnewline
4 & 574.382276885351 \tabularnewline
5 & 576.725237873287 \tabularnewline
6 & 687.102612424083 \tabularnewline
7 & 797.6929233734 \tabularnewline
8 & 899.527097979822 \tabularnewline
9 & 921.76135740223 \tabularnewline
10 & 987.071425986995 \tabularnewline
11 & 991.957156332873 \tabularnewline
12 & 1049.66185031180 \tabularnewline
13 & 1154.06585600649 \tabularnewline
14 & 1188.86079925280 \tabularnewline
15 & 1215.39484450863 \tabularnewline
16 & 1264.83414195639 \tabularnewline
17 & 1531.38172902774 \tabularnewline
18 & 1583.44213661251 \tabularnewline
19 & 1656.12497571994 \tabularnewline
20 & 1701.45554008891 \tabularnewline
21 & 1709.39051044378 \tabularnewline
22 & 1711.76458661815 \tabularnewline
23 & 1728.07940745406 \tabularnewline
24 & 1782.03338913725 \tabularnewline
25 & 1786.05189254132 \tabularnewline
26 & 1807.7997676734 \tabularnewline
27 & 1981.23251604139 \tabularnewline
28 & 2186.98602122778 \tabularnewline
29 & 2214.72382289698 \tabularnewline
30 & 2219.36850279006 \tabularnewline
31 & 2383.54441955672 \tabularnewline
32 & 2454.32332833309 \tabularnewline
33 & 2685.48505860673 \tabularnewline
34 & 2751.39442265342 \tabularnewline
35 & 3039.89914608524 \tabularnewline
36 & 3258.48523090101 \tabularnewline
37 & 3400.86419448281 \tabularnewline
38 & 4553.08170992789 \tabularnewline
39 & 5000.84572847433 \tabularnewline
40 & 5413.26029045633 \tabularnewline
41 & 7093.83625638218 \tabularnewline
42 & 7137.27342430782 \tabularnewline
43 & 11100.6533915921 \tabularnewline
44 & 12292.7485138658 \tabularnewline
45 & 13975.6100894354 \tabularnewline
46 & 14291.8457596770 \tabularnewline
47 & 15579.2933443598 \tabularnewline
48 & 17127.17108901 \tabularnewline
49 & 19374.0716627875 \tabularnewline
50 & 23471.3359332478 \tabularnewline
51 & 38166.4365890079 \tabularnewline
52 & 39431.507023291 \tabularnewline
53 & 45548.2852153164 \tabularnewline
54 & 47364.3304340991 \tabularnewline
55 & 71004.9194482464 \tabularnewline
56 & 82515.4041534364 \tabularnewline
57 & 221440.723909685 \tabularnewline
58 & 241733.336558712 \tabularnewline
59 & 650126.939935581 \tabularnewline
60 & 1039084.96545092 \tabularnewline
\hline
\end{tabular}
%Source: https://freestatistics.org/blog/index.php?pk=23508&T=1

[TABLE]
[ROW][C]Summary of Dendrogram[/C][/ROW]
[ROW][C]Label[/C][C]Height[/C][/ROW]
[ROW][C]1[/C][C]162.299106590271[/C][/ROW]
[ROW][C]2[/C][C]352.193128837006[/C][/ROW]
[ROW][C]3[/C][C]517.149487473929[/C][/ROW]
[ROW][C]4[/C][C]574.382276885351[/C][/ROW]
[ROW][C]5[/C][C]576.725237873287[/C][/ROW]
[ROW][C]6[/C][C]687.102612424083[/C][/ROW]
[ROW][C]7[/C][C]797.6929233734[/C][/ROW]
[ROW][C]8[/C][C]899.527097979822[/C][/ROW]
[ROW][C]9[/C][C]921.76135740223[/C][/ROW]
[ROW][C]10[/C][C]987.071425986995[/C][/ROW]
[ROW][C]11[/C][C]991.957156332873[/C][/ROW]
[ROW][C]12[/C][C]1049.66185031180[/C][/ROW]
[ROW][C]13[/C][C]1154.06585600649[/C][/ROW]
[ROW][C]14[/C][C]1188.86079925280[/C][/ROW]
[ROW][C]15[/C][C]1215.39484450863[/C][/ROW]
[ROW][C]16[/C][C]1264.83414195639[/C][/ROW]
[ROW][C]17[/C][C]1531.38172902774[/C][/ROW]
[ROW][C]18[/C][C]1583.44213661251[/C][/ROW]
[ROW][C]19[/C][C]1656.12497571994[/C][/ROW]
[ROW][C]20[/C][C]1701.45554008891[/C][/ROW]
[ROW][C]21[/C][C]1709.39051044378[/C][/ROW]
[ROW][C]22[/C][C]1711.76458661815[/C][/ROW]
[ROW][C]23[/C][C]1728.07940745406[/C][/ROW]
[ROW][C]24[/C][C]1782.03338913725[/C][/ROW]
[ROW][C]25[/C][C]1786.05189254132[/C][/ROW]
[ROW][C]26[/C][C]1807.7997676734[/C][/ROW]
[ROW][C]27[/C][C]1981.23251604139[/C][/ROW]
[ROW][C]28[/C][C]2186.98602122778[/C][/ROW]
[ROW][C]29[/C][C]2214.72382289698[/C][/ROW]
[ROW][C]30[/C][C]2219.36850279006[/C][/ROW]
[ROW][C]31[/C][C]2383.54441955672[/C][/ROW]
[ROW][C]32[/C][C]2454.32332833309[/C][/ROW]
[ROW][C]33[/C][C]2685.48505860673[/C][/ROW]
[ROW][C]34[/C][C]2751.39442265342[/C][/ROW]
[ROW][C]35[/C][C]3039.89914608524[/C][/ROW]
[ROW][C]36[/C][C]3258.48523090101[/C][/ROW]
[ROW][C]37[/C][C]3400.86419448281[/C][/ROW]
[ROW][C]38[/C][C]4553.08170992789[/C][/ROW]
[ROW][C]39[/C][C]5000.84572847433[/C][/ROW]
[ROW][C]40[/C][C]5413.26029045633[/C][/ROW]
[ROW][C]41[/C][C]7093.83625638218[/C][/ROW]
[ROW][C]42[/C][C]7137.27342430782[/C][/ROW]
[ROW][C]43[/C][C]11100.6533915921[/C][/ROW]
[ROW][C]44[/C][C]12292.7485138658[/C][/ROW]
[ROW][C]45[/C][C]13975.6100894354[/C][/ROW]
[ROW][C]46[/C][C]14291.8457596770[/C][/ROW]
[ROW][C]47[/C][C]15579.2933443598[/C][/ROW]
[ROW][C]48[/C][C]17127.17108901[/C][/ROW]
[ROW][C]49[/C][C]19374.0716627875[/C][/ROW]
[ROW][C]50[/C][C]23471.3359332478[/C][/ROW]
[ROW][C]51[/C][C]38166.4365890079[/C][/ROW]
[ROW][C]52[/C][C]39431.507023291[/C][/ROW]
[ROW][C]53[/C][C]45548.2852153164[/C][/ROW]
[ROW][C]54[/C][C]47364.3304340991[/C][/ROW]
[ROW][C]55[/C][C]71004.9194482464[/C][/ROW]
[ROW][C]56[/C][C]82515.4041534364[/C][/ROW]
[ROW][C]57[/C][C]221440.723909685[/C][/ROW]
[ROW][C]58[/C][C]241733.336558712[/C][/ROW]
[ROW][C]59[/C][C]650126.939935581[/C][/ROW]
[ROW][C]60[/C][C]1039084.96545092[/C][/ROW]
[/TABLE]
Source: https://freestatistics.org/blog/index.php?pk=23508&T=1

Globally Unique Identifier (entire table): ba.freestatistics.org/blog/index.php?pk=23508&T=1

As an alternative you can also use a QR Code:  

The GUIDs for individual cells are displayed in the table below:

Summary of Dendrogram
LabelHeight
1162.299106590271
2352.193128837006
3517.149487473929
4574.382276885351
5576.725237873287
6687.102612424083
7797.6929233734
8899.527097979822
9921.76135740223
10987.071425986995
11991.957156332873
121049.66185031180
131154.06585600649
141188.86079925280
151215.39484450863
161264.83414195639
171531.38172902774
181583.44213661251
191656.12497571994
201701.45554008891
211709.39051044378
221711.76458661815
231728.07940745406
241782.03338913725
251786.05189254132
261807.7997676734
271981.23251604139
282186.98602122778
292214.72382289698
302219.36850279006
312383.54441955672
322454.32332833309
332685.48505860673
342751.39442265342
353039.89914608524
363258.48523090101
373400.86419448281
384553.08170992789
395000.84572847433
405413.26029045633
417093.83625638218
427137.27342430782
4311100.6533915921
4412292.7485138658
4513975.6100894354
4614291.8457596770
4715579.2933443598
4817127.17108901
4919374.0716627875
5023471.3359332478
5138166.4365890079
5239431.507023291
5345548.2852153164
5447364.3304340991
5571004.9194482464
5682515.4041534364
57221440.723909685
58241733.336558712
59650126.939935581
601039084.96545092


Summary of Cut Dendrogram
LabelHeight
125020.4048728163
236725.7257123583
345845.7230723615
4114442.133936008

\begin{tabular}{lllllllll}
\hline
Summary of Cut Dendrogram \tabularnewline
Label & Height \tabularnewline
1 & 25020.4048728163 \tabularnewline
2 & 36725.7257123583 \tabularnewline
3 & 45845.7230723615 \tabularnewline
4 & 114442.133936008 \tabularnewline
\hline
\end{tabular}
%Source: https://freestatistics.org/blog/index.php?pk=23508&T=2

[TABLE]
[ROW][C]Summary of Cut Dendrogram[/C][/ROW]
[ROW][C]Label[/C][C]Height[/C][/ROW]
[ROW][C]1[/C][C]25020.4048728163[/C][/ROW]
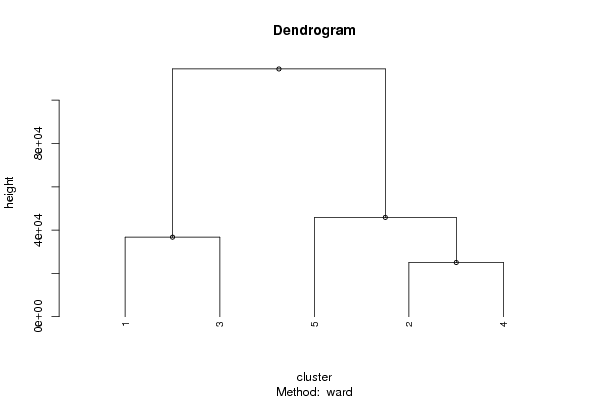
[ROW][C]2[/C][C]36725.7257123583[/C][/ROW]
[ROW][C]3[/C][C]45845.7230723615[/C][/ROW]
[ROW][C]4[/C][C]114442.133936008[/C][/ROW]
[/TABLE]
Source: https://freestatistics.org/blog/index.php?pk=23508&T=2

Globally Unique Identifier (entire table): ba.freestatistics.org/blog/index.php?pk=23508&T=2

As an alternative you can also use a QR Code:  

The GUIDs for individual cells are displayed in the table below:

Summary of Cut Dendrogram
LabelHeight
125020.4048728163
236725.7257123583
345845.7230723615
4114442.133936008


Parameters (Session):
par1 = ward ; par2 = 5 ; par3 = FALSE ; par4 = FALSE ;
Parameters (R input):
par1 = ward ; par2 = 5 ; par3 = FALSE ; par4 = FALSE ;
R code (references can be found in the software module):
par3 <- as.logical(par3)
par4 <- as.logical(par4)
if (par3 == 'TRUE'){
dum = xlab
xlab = ylab
ylab = dum
}
x <- t(y)
hc <- hclust(dist(x),method=par1)
d <- as.dendrogram(hc)
str(d)
mysub <- paste('Method: ',par1)
bitmap(file='test1.png')
if (par4 == 'TRUE'){
plot(d,main=main,ylab=ylab,xlab=xlab,horiz=par3, nodePar=list(pch = c(1,NA), cex=0.8, lab.cex = 0.8),type='t',center=T, sub=mysub)
} else {
plot(d,main=main,ylab=ylab,xlab=xlab,horiz=par3, nodePar=list(pch = c(1,NA), cex=0.8, lab.cex = 0.8), sub=mysub)
}
dev.off()
if (par2 != 'ALL'){
if (par3 == 'TRUE'){
ylab = 'cluster'
} else {
xlab = 'cluster'
}
par2 <- as.numeric(par2)
memb <- cutree(hc, k = par2)
cent <- NULL
for(k in 1:par2){
cent <- rbind(cent, colMeans(x[memb == k, , drop = FALSE]))
}
hc1 <- hclust(dist(cent),method=par1, members = table(memb))
de <- as.dendrogram(hc1)
bitmap(file='test2.png')
if (par4 == 'TRUE'){
plot(de,main=main,ylab=ylab,xlab=xlab,horiz=par3, nodePar=list(pch = c(1,NA), cex=0.8, lab.cex = 0.8),type='t',center=T, sub=mysub)
} else {
plot(de,main=main,ylab=ylab,xlab=xlab,horiz=par3, nodePar=list(pch = c(1,NA), cex=0.8, lab.cex = 0.8), sub=mysub)
}
dev.off()
str(de)
}
load(file='createtable')
a<-table.start()
a<-table.row.start(a)
a<-table.element(a,'Summary of Dendrogram',2,TRUE)
a<-table.row.end(a)
a<-table.row.start(a)
a<-table.element(a,'Label',header=TRUE)
a<-table.element(a,'Height',header=TRUE)
a<-table.row.end(a)
num <- length(x[,1])-1
for (i in 1:num)
{
a<-table.row.start(a)
a<-table.element(a,hc$labels[i])
a<-table.element(a,hc$height[i])
a<-table.row.end(a)
}
a<-table.end(a)
table.save(a,file='mytable1.tab')
if (par2 != 'ALL'){
a<-table.start()
a<-table.row.start(a)
a<-table.element(a,'Summary of Cut Dendrogram',2,TRUE)
a<-table.row.end(a)
a<-table.row.start(a)
a<-table.element(a,'Label',header=TRUE)
a<-table.element(a,'Height',header=TRUE)
a<-table.row.end(a)
num <- par2-1
for (i in 1:num)
{
a<-table.row.start(a)
a<-table.element(a,i)
a<-table.element(a,hc1$height[i])
a<-table.row.end(a)
}
a<-table.end(a)
table.save(a,file='mytable2.tab')
}