Free Statistics

of Irreproducible Research!

Author's title

Author*The author of this computation has been verified*
R Software Modulerwasp_bidensity.wasp
Title produced by softwareBivariate Kernel Density Estimation
Date of computationTue, 11 Nov 2008 06:04:27 -0700
Cite this page as followsStatistical Computations at FreeStatistics.org, Office for Research Development and Education, URL https://freestatistics.org/blog/index.php?v=date/2008/Nov/11/t12264087813wredtwxu2tt0rf.htm/, Retrieved Sun, 19 May 2024 12:39:11 +0000
Statistical Computations at FreeStatistics.org, Office for Research Development and Education, URL https://freestatistics.org/blog/index.php?pk=23435, Retrieved Sun, 19 May 2024 12:39:11 +0000
QR Codes:

Original text written by user:
IsPrivate?No (this computation is public)
User-defined keywords
Estimated Impact158
Family? (F = Feedback message, R = changed R code, M = changed R Module, P = changed Parameters, D = changed Data)
F     [Notched Boxplots] [workshop 3] [2007-10-26 13:31:48] [e9ffc5de6f8a7be62f22b142b5b6b1a8]
F    D  [Notched Boxplots] [Q1 - Notched Boxplot] [2008-11-03 09:57:32] [a7f04e0e73ce3683561193958d653479]
F RMPD      [Bivariate Kernel Density Estimation] [Various EDA topic...] [2008-11-11 13:04:27] [f1a30f1149cef3ef3ef69d586c6c3c1c] [Current]
F    D        [Bivariate Kernel Density Estimation] [Various EDA topic...] [2008-11-11 13:51:35] [a7f04e0e73ce3683561193958d653479]
F RMPD        [Hierarchical Clustering] [Various EDA topic...] [2008-11-11 14:17:41] [a7f04e0e73ce3683561193958d653479]
Feedback Forum
2008-11-20 09:10:49 [An De Koninck] [reply
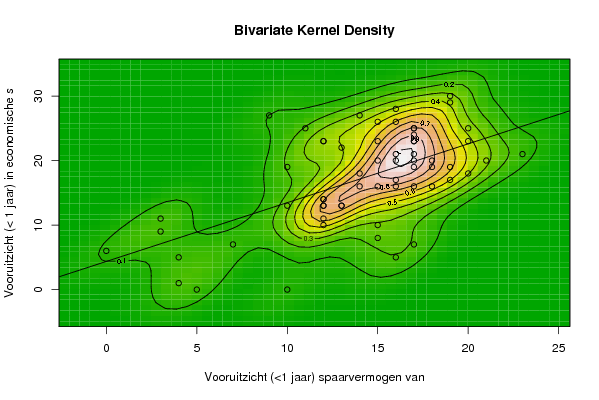
Er is inderdaad sprake van een vrij grote samenhang tussen het spaarvermogen van de gezinnen en de economische situatie, wat me los van cijfers en statistieken logisch lijkt.
Naast het getal van de correlatie van 0.59143406672748 kan je dit ook duidelijk zien aan de grafiek.
Er is één grote cluster, waaruit het positief verband tussen deze twee variabelen reeds blijkt.
In de cluster zie je veel hoogtelijnen, en je ziet dan duidelijk dat er een hoge dichtheid is. Vele punten zijn immers gecentraliseerd in het midden van deze cluster. De kleuren gaan van rood (heel hoge dichtheid)over oranje en geel naar groen (kleinere dichtheid).
Er is eigenlijk maar één hoogtelijn (de buitenste) die er was uitspringt en die een staart vertoont.
2008-11-24 11:28:14 [Steven Hulsmans] [reply
Er is inderdaad een grote correlatie tussen de 2 variabelen. We zien dt ook aan de hoogtelijnen, want deze verbinden punten met een gelijke dichtheid met mekaar.

Post a new message
Dataseries X:
10
12
12
13
17
12
15
12
14
19
16
17
16
19
17
17
20
18
16
19
18
23
20
20
15
17
16
15
10
13
10
19
21
17
16
17
14
18
17
14
15
16
11
15
13
17
16
9
17
15
12
12
12
12
4
7
4
3
3
0
5
Dataseries Y:
19
14
11
13
21
10
23
23
27
30
28
25
21
29
20
24
23
16
17
19
19
21
25
18
8
7
5
10
0
13
13
17
20
19
16
16
16
20
23
18
20
26
25
16
22
23
20
27
25
26
23
13
13
14
1
7
5
9
11
6
0


Summary of computational transaction
Raw Inputview raw input (R code)
Raw Outputview raw output of R engine
Computing time1 seconds
R Server'Gwilym Jenkins' @ 72.249.127.135

\begin{tabular}{lllllllll}
\hline
Summary of computational transaction \tabularnewline
Raw Input & view raw input (R code)  \tabularnewline
Raw Output & view raw output of R engine  \tabularnewline
Computing time & 1 seconds \tabularnewline
R Server & 'Gwilym Jenkins' @ 72.249.127.135 \tabularnewline
\hline
\end{tabular}
%Source: https://freestatistics.org/blog/index.php?pk=23435&T=0

[TABLE]
[ROW][C]Summary of computational transaction[/C][/ROW]
[ROW][C]Raw Input[/C][C]view raw input (R code) [/C][/ROW]
[ROW][C]Raw Output[/C][C]view raw output of R engine [/C][/ROW]
[ROW][C]Computing time[/C][C]1 seconds[/C][/ROW]
[ROW][C]R Server[/C][C]'Gwilym Jenkins' @ 72.249.127.135[/C][/ROW]
[/TABLE]
Source: https://freestatistics.org/blog/index.php?pk=23435&T=0

Globally Unique Identifier (entire table): ba.freestatistics.org/blog/index.php?pk=23435&T=0

As an alternative you can also use a QR Code:  

The GUIDs for individual cells are displayed in the table below:

Summary of computational transaction
Raw Inputview raw input (R code)
Raw Outputview raw output of R engine
Computing time1 seconds
R Server'Gwilym Jenkins' @ 72.249.127.135


Bandwidth
x axis1.55385919601336
y axis3.54409029282468
Correlation
correlation used in KDE0.59143406672748
correlation(x,y)0.59143406672748

\begin{tabular}{lllllllll}
\hline
Bandwidth \tabularnewline
x axis & 1.55385919601336 \tabularnewline
y axis & 3.54409029282468 \tabularnewline
Correlation \tabularnewline
correlation used in KDE & 0.59143406672748 \tabularnewline
correlation(x,y) & 0.59143406672748 \tabularnewline
\hline
\end{tabular}
%Source: https://freestatistics.org/blog/index.php?pk=23435&T=1

[TABLE]
[ROW][C]Bandwidth[/C][/ROW]
[ROW][C]x axis[/C][C]1.55385919601336[/C][/ROW]
[ROW][C]y axis[/C][C]3.54409029282468[/C][/ROW]
[ROW][C]Correlation[/C][/ROW]
[ROW][C]correlation used in KDE[/C][C]0.59143406672748[/C][/ROW]
[ROW][C]correlation(x,y)[/C][C]0.59143406672748[/C][/ROW]
[/TABLE]
Source: https://freestatistics.org/blog/index.php?pk=23435&T=1

Globally Unique Identifier (entire table): ba.freestatistics.org/blog/index.php?pk=23435&T=1

As an alternative you can also use a QR Code:  

The GUIDs for individual cells are displayed in the table below:

Bandwidth
x axis1.55385919601336
y axis3.54409029282468
Correlation
correlation used in KDE0.59143406672748
correlation(x,y)0.59143406672748


Parameters (Session):
par1 = 50 ; par2 = 50 ; par3 = 0 ; par4 = 0 ; par5 = 0 ; par6 = Y ; par7 = Y ;
Parameters (R input):
par1 = 50 ; par2 = 50 ; par3 = 0 ; par4 = 0 ; par5 = 0 ; par6 = Y ; par7 = Y ;
R code (references can be found in the software module):
par1 <- as(par1,'numeric')
par2 <- as(par2,'numeric')
par3 <- as(par3,'numeric')
par4 <- as(par4,'numeric')
par5 <- as(par5,'numeric')
library('GenKern')
if (par3==0) par3 <- dpik(x)
if (par4==0) par4 <- dpik(y)
if (par5==0) par5 <- cor(x,y)
if (par1 > 500) par1 <- 500
if (par2 > 500) par2 <- 500
bitmap(file='bidensity.png')
op <- KernSur(x,y, xgridsize=par1, ygridsize=par2, correlation=par5, xbandwidth=par3, ybandwidth=par4)
image(op$xords, op$yords, op$zden, col=terrain.colors(100), axes=TRUE,main=main,xlab=xlab,ylab=ylab)
if (par6=='Y') contour(op$xords, op$yords, op$zden, add=TRUE)
if (par7=='Y') points(x,y)
(r<-lm(y ~ x))
abline(r)
box()
dev.off()
load(file='createtable')
a<-table.start()
a<-table.row.start(a)
a<-table.element(a,'Bandwidth',2,TRUE)
a<-table.row.end(a)
a<-table.row.start(a)
a<-table.element(a,'x axis',header=TRUE)
a<-table.element(a,par3)
a<-table.row.end(a)
a<-table.row.start(a)
a<-table.element(a,'y axis',header=TRUE)
a<-table.element(a,par4)
a<-table.row.end(a)
a<-table.row.start(a)
a<-table.element(a,'Correlation',2,TRUE)
a<-table.row.end(a)
a<-table.row.start(a)
a<-table.element(a,'correlation used in KDE',header=TRUE)
a<-table.element(a,par5)
a<-table.row.end(a)
a<-table.row.start(a)
a<-table.element(a,'correlation(x,y)',header=TRUE)
a<-table.element(a,cor(x,y))
a<-table.row.end(a)
a<-table.end(a)
table.save(a,file='mytable.tab')