Free Statistics

of Irreproducible Research!

Author's title

Author*The author of this computation has been verified*
R Software Modulerwasp_hierarchicalclustering.wasp
Title produced by softwareHierarchical Clustering
Date of computationTue, 11 Nov 2008 05:40:18 -0700
Cite this page as followsStatistical Computations at FreeStatistics.org, Office for Research Development and Education, URL https://freestatistics.org/blog/index.php?v=date/2008/Nov/11/t122640726830bqriq2y1r6xv1.htm/, Retrieved Sun, 19 May 2024 10:10:37 +0000
Statistical Computations at FreeStatistics.org, Office for Research Development and Education, URL https://freestatistics.org/blog/index.php?pk=23404, Retrieved Sun, 19 May 2024 10:10:37 +0000
QR Codes:

Original text written by user:
IsPrivate?No (this computation is public)
User-defined keywords
Estimated Impact127
Family? (F = Feedback message, R = changed R code, M = changed R Module, P = changed Parameters, D = changed Data)
-       [Hierarchical Clustering] [Q2 Hierarchical C...] [2008-11-11 12:40:18] [21d7d81e7693ad6dde5aadefb1046611] [Current]
Feedback Forum

Post a new message
Dataseries X:
604.4	882.5	1.1663
883.9	789.6	1.1372
527.9	773.3	1.1139
756.2	804.3	1.1222
812.9	817.8	1.1692
655.6	836.7	1.1702
707.6	721.8	1.2286
612.6	760.8	1.2613
659.2	841.4	1.2646
833.4	1045.6	1.2262
727.8	949.2	1.1985
797.2	850.1	1.2007
753	957.4	1.2138
762	851.8	1.2266
613.7	913.9	1.2176
759.2	888	1.2218
816.4	973.8	1.249
736.8	927.6	1.2991
680.1	833	1.3408
736.5	879.5	1.3119
637.2	797.3	1.3014
801.9	834.5	1.3201
772.3	735.1	1.2938
897.3	835	1.2694
792.1	892.8	1.2165
826.8	697.2	1.2037
666.8	821.1	1.2292
906.6	732.7	1.2256
871.4	797.6	1.2015
891	866.3	1.1786
739.2	826.3	1.1856
833.6	778.6	1.2103
715.6	779.2	1.1938
871.6	951	1.202
751.6	692.3	1.2271
1005.5	841.4	1.277
681.2	857.3	1.265
837.3	760.7	1.2684
674.7	841.2	1.2811
806.3	810.3	1.2727
860.2	1007.4	1.2611
689.8	931.3	1.2881
691.6	931.2	1.3213
682.6	855.8	1.2999
800.1	858.4	1.3074
1023.7	925.9	1.3242
733.5	930.7	1.3516
875.3	1037.6	1.3511
770.2	979.2	1.3419
1005.7	942.6	1.3716
982.3	843.9	1.3622
742.9	854.3	1.3896
974.2	1029.8	1.4227
822.3	944	1.4684
773.2	856.4	1.457
750.9	1059.4	1.4718
708	959.3	1.4748
690	941.5	1.5527
652.8	1026.4	1.575
620.7	921.3	1.5557
461.9	968	1.5553


Summary of computational transaction
Raw Inputview raw input (R code)
Raw Outputview raw output of R engine
Computing time2 seconds
R Server'Sir Ronald Aylmer Fisher' @ 193.190.124.24

\begin{tabular}{lllllllll}
\hline
Summary of computational transaction \tabularnewline
Raw Input & view raw input (R code)  \tabularnewline
Raw Output & view raw output of R engine  \tabularnewline
Computing time & 2 seconds \tabularnewline
R Server & 'Sir Ronald Aylmer Fisher' @ 193.190.124.24 \tabularnewline
\hline
\end{tabular}
%Source: https://freestatistics.org/blog/index.php?pk=23404&T=0

[TABLE]
[ROW][C]Summary of computational transaction[/C][/ROW]
[ROW][C]Raw Input[/C][C]view raw input (R code) [/C][/ROW]
[ROW][C]Raw Output[/C][C]view raw output of R engine [/C][/ROW]
[ROW][C]Computing time[/C][C]2 seconds[/C][/ROW]
[ROW][C]R Server[/C][C]'Sir Ronald Aylmer Fisher' @ 193.190.124.24[/C][/ROW]
[/TABLE]
Source: https://freestatistics.org/blog/index.php?pk=23404&T=0

Globally Unique Identifier (entire table): ba.freestatistics.org/blog/index.php?pk=23404&T=0

As an alternative you can also use a QR Code:  

The GUIDs for individual cells are displayed in the table below:

Summary of computational transaction
Raw Inputview raw input (R code)
Raw Outputview raw output of R engine
Computing time2 seconds
R Server'Sir Ronald Aylmer Fisher' @ 193.190.124.24


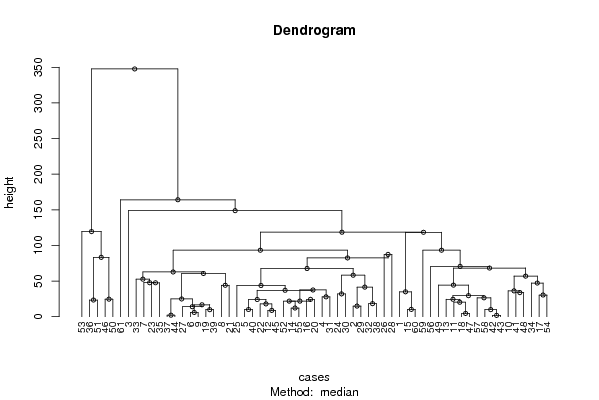
Summary of Dendrogram
LabelHeight
11.80308131818846
22.05212524227931
34.52799693573216
45.92105660841032
58.79268928656069
69.8185316667005
79.86497499333924
89.99103159088191
910.1918747838658
1012.1100406341185
1114.8409613735095
1216.6720934716398
1313.9455400924276
1417.9322095892379
1518.2784948945475
1620.2475127913014
1721.7906734679589
1823.3344650472215
1924.0448537067480
2024.2393918655151
2121.8234339341735
2224.3678545546012
2324.5538641920167
2424.815619925492
2526.4487813998727
2627.802949835584
2729.5107259301948
2830.3792385743948
2931.9278600072100
3033.764746408051
3134.8694910059617
3236.2190928412618
3337.4254342070879
3437.0057548266252
3541.4384160488352
3643.7800157692746
3744.01603807716
3844.2771723359772
3947.1644758442788
4047.5429747585277
4147.6277263469206
4252.6008223658578
4356.8841586326254
4458.1639640483043
4560.5944301658453
4662.7155484076423
4767.6125280361236
4868.2130540368082
4970.5402426624316
5083.261006124305
5187.340085182063
5282.388808297757
5393.2322486497234
5493.2833581563197
55118.394094366763
56118.483177327514
57119.414421371741
58148.747834676578
59164.065424173577
60347.656605162355

\begin{tabular}{lllllllll}
\hline
Summary of Dendrogram \tabularnewline
Label & Height \tabularnewline
1 & 1.80308131818846 \tabularnewline
2 & 2.05212524227931 \tabularnewline
3 & 4.52799693573216 \tabularnewline
4 & 5.92105660841032 \tabularnewline
5 & 8.79268928656069 \tabularnewline
6 & 9.8185316667005 \tabularnewline
7 & 9.86497499333924 \tabularnewline
8 & 9.99103159088191 \tabularnewline
9 & 10.1918747838658 \tabularnewline
10 & 12.1100406341185 \tabularnewline
11 & 14.8409613735095 \tabularnewline
12 & 16.6720934716398 \tabularnewline
13 & 13.9455400924276 \tabularnewline
14 & 17.9322095892379 \tabularnewline
15 & 18.2784948945475 \tabularnewline
16 & 20.2475127913014 \tabularnewline
17 & 21.7906734679589 \tabularnewline
18 & 23.3344650472215 \tabularnewline
19 & 24.0448537067480 \tabularnewline
20 & 24.2393918655151 \tabularnewline
21 & 21.8234339341735 \tabularnewline
22 & 24.3678545546012 \tabularnewline
23 & 24.5538641920167 \tabularnewline
24 & 24.815619925492 \tabularnewline
25 & 26.4487813998727 \tabularnewline
26 & 27.802949835584 \tabularnewline
27 & 29.5107259301948 \tabularnewline
28 & 30.3792385743948 \tabularnewline
29 & 31.9278600072100 \tabularnewline
30 & 33.764746408051 \tabularnewline
31 & 34.8694910059617 \tabularnewline
32 & 36.2190928412618 \tabularnewline
33 & 37.4254342070879 \tabularnewline
34 & 37.0057548266252 \tabularnewline
35 & 41.4384160488352 \tabularnewline
36 & 43.7800157692746 \tabularnewline
37 & 44.01603807716 \tabularnewline
38 & 44.2771723359772 \tabularnewline
39 & 47.1644758442788 \tabularnewline
40 & 47.5429747585277 \tabularnewline
41 & 47.6277263469206 \tabularnewline
42 & 52.6008223658578 \tabularnewline
43 & 56.8841586326254 \tabularnewline
44 & 58.1639640483043 \tabularnewline
45 & 60.5944301658453 \tabularnewline
46 & 62.7155484076423 \tabularnewline
47 & 67.6125280361236 \tabularnewline
48 & 68.2130540368082 \tabularnewline
49 & 70.5402426624316 \tabularnewline
50 & 83.261006124305 \tabularnewline
51 & 87.340085182063 \tabularnewline
52 & 82.388808297757 \tabularnewline
53 & 93.2322486497234 \tabularnewline
54 & 93.2833581563197 \tabularnewline
55 & 118.394094366763 \tabularnewline
56 & 118.483177327514 \tabularnewline
57 & 119.414421371741 \tabularnewline
58 & 148.747834676578 \tabularnewline
59 & 164.065424173577 \tabularnewline
60 & 347.656605162355 \tabularnewline
\hline
\end{tabular}
%Source: https://freestatistics.org/blog/index.php?pk=23404&T=1

[TABLE]
[ROW][C]Summary of Dendrogram[/C][/ROW]
[ROW][C]Label[/C][C]Height[/C][/ROW]
[ROW][C]1[/C][C]1.80308131818846[/C][/ROW]
[ROW][C]2[/C][C]2.05212524227931[/C][/ROW]
[ROW][C]3[/C][C]4.52799693573216[/C][/ROW]
[ROW][C]4[/C][C]5.92105660841032[/C][/ROW]
[ROW][C]5[/C][C]8.79268928656069[/C][/ROW]
[ROW][C]6[/C][C]9.8185316667005[/C][/ROW]
[ROW][C]7[/C][C]9.86497499333924[/C][/ROW]
[ROW][C]8[/C][C]9.99103159088191[/C][/ROW]
[ROW][C]9[/C][C]10.1918747838658[/C][/ROW]
[ROW][C]10[/C][C]12.1100406341185[/C][/ROW]
[ROW][C]11[/C][C]14.8409613735095[/C][/ROW]
[ROW][C]12[/C][C]16.6720934716398[/C][/ROW]
[ROW][C]13[/C][C]13.9455400924276[/C][/ROW]
[ROW][C]14[/C][C]17.9322095892379[/C][/ROW]
[ROW][C]15[/C][C]18.2784948945475[/C][/ROW]
[ROW][C]16[/C][C]20.2475127913014[/C][/ROW]
[ROW][C]17[/C][C]21.7906734679589[/C][/ROW]
[ROW][C]18[/C][C]23.3344650472215[/C][/ROW]
[ROW][C]19[/C][C]24.0448537067480[/C][/ROW]
[ROW][C]20[/C][C]24.2393918655151[/C][/ROW]
[ROW][C]21[/C][C]21.8234339341735[/C][/ROW]
[ROW][C]22[/C][C]24.3678545546012[/C][/ROW]
[ROW][C]23[/C][C]24.5538641920167[/C][/ROW]
[ROW][C]24[/C][C]24.815619925492[/C][/ROW]
[ROW][C]25[/C][C]26.4487813998727[/C][/ROW]
[ROW][C]26[/C][C]27.802949835584[/C][/ROW]
[ROW][C]27[/C][C]29.5107259301948[/C][/ROW]
[ROW][C]28[/C][C]30.3792385743948[/C][/ROW]
[ROW][C]29[/C][C]31.9278600072100[/C][/ROW]
[ROW][C]30[/C][C]33.764746408051[/C][/ROW]
[ROW][C]31[/C][C]34.8694910059617[/C][/ROW]
[ROW][C]32[/C][C]36.2190928412618[/C][/ROW]
[ROW][C]33[/C][C]37.4254342070879[/C][/ROW]
[ROW][C]34[/C][C]37.0057548266252[/C][/ROW]
[ROW][C]35[/C][C]41.4384160488352[/C][/ROW]
[ROW][C]36[/C][C]43.7800157692746[/C][/ROW]
[ROW][C]37[/C][C]44.01603807716[/C][/ROW]
[ROW][C]38[/C][C]44.2771723359772[/C][/ROW]
[ROW][C]39[/C][C]47.1644758442788[/C][/ROW]
[ROW][C]40[/C][C]47.5429747585277[/C][/ROW]
[ROW][C]41[/C][C]47.6277263469206[/C][/ROW]
[ROW][C]42[/C][C]52.6008223658578[/C][/ROW]
[ROW][C]43[/C][C]56.8841586326254[/C][/ROW]
[ROW][C]44[/C][C]58.1639640483043[/C][/ROW]
[ROW][C]45[/C][C]60.5944301658453[/C][/ROW]
[ROW][C]46[/C][C]62.7155484076423[/C][/ROW]
[ROW][C]47[/C][C]67.6125280361236[/C][/ROW]
[ROW][C]48[/C][C]68.2130540368082[/C][/ROW]
[ROW][C]49[/C][C]70.5402426624316[/C][/ROW]
[ROW][C]50[/C][C]83.261006124305[/C][/ROW]
[ROW][C]51[/C][C]87.340085182063[/C][/ROW]
[ROW][C]52[/C][C]82.388808297757[/C][/ROW]
[ROW][C]53[/C][C]93.2322486497234[/C][/ROW]
[ROW][C]54[/C][C]93.2833581563197[/C][/ROW]
[ROW][C]55[/C][C]118.394094366763[/C][/ROW]
[ROW][C]56[/C][C]118.483177327514[/C][/ROW]
[ROW][C]57[/C][C]119.414421371741[/C][/ROW]
[ROW][C]58[/C][C]148.747834676578[/C][/ROW]
[ROW][C]59[/C][C]164.065424173577[/C][/ROW]
[ROW][C]60[/C][C]347.656605162355[/C][/ROW]
[/TABLE]
Source: https://freestatistics.org/blog/index.php?pk=23404&T=1

Globally Unique Identifier (entire table): ba.freestatistics.org/blog/index.php?pk=23404&T=1

As an alternative you can also use a QR Code:  

The GUIDs for individual cells are displayed in the table below:

Summary of Dendrogram
LabelHeight
11.80308131818846
22.05212524227931
34.52799693573216
45.92105660841032
58.79268928656069
69.8185316667005
79.86497499333924
89.99103159088191
910.1918747838658
1012.1100406341185
1114.8409613735095
1216.6720934716398
1313.9455400924276
1417.9322095892379
1518.2784948945475
1620.2475127913014
1721.7906734679589
1823.3344650472215
1924.0448537067480
2024.2393918655151
2121.8234339341735
2224.3678545546012
2324.5538641920167
2424.815619925492
2526.4487813998727
2627.802949835584
2729.5107259301948
2830.3792385743948
2931.9278600072100
3033.764746408051
3134.8694910059617
3236.2190928412618
3337.4254342070879
3437.0057548266252
3541.4384160488352
3643.7800157692746
3744.01603807716
3844.2771723359772
3947.1644758442788
4047.5429747585277
4147.6277263469206
4252.6008223658578
4356.8841586326254
4458.1639640483043
4560.5944301658453
4662.7155484076423
4767.6125280361236
4868.2130540368082
4970.5402426624316
5083.261006124305
5187.340085182063
5282.388808297757
5393.2322486497234
5493.2833581563197
55118.394094366763
56118.483177327514
57119.414421371741
58148.747834676578
59164.065424173577
60347.656605162355


Summary of Cut Dendrogram
LabelHeight
168.8546603422424
269.990417748164
370.9291223626718
476.4701877720257
577.4372354901938
674.688833757386
787.089462301966
893.9318944815338
998.9156089624366
1094.1152061038833
11102.667463150242
1292.0163478349846
1388.7263862345502
14107.248613071676
15113.581604995546
16137.298051000995
17159.317859707047
18153.275517736675
19297.454571234322

\begin{tabular}{lllllllll}
\hline
Summary of Cut Dendrogram \tabularnewline
Label & Height \tabularnewline
1 & 68.8546603422424 \tabularnewline
2 & 69.990417748164 \tabularnewline
3 & 70.9291223626718 \tabularnewline
4 & 76.4701877720257 \tabularnewline
5 & 77.4372354901938 \tabularnewline
6 & 74.688833757386 \tabularnewline
7 & 87.089462301966 \tabularnewline
8 & 93.9318944815338 \tabularnewline
9 & 98.9156089624366 \tabularnewline
10 & 94.1152061038833 \tabularnewline
11 & 102.667463150242 \tabularnewline
12 & 92.0163478349846 \tabularnewline
13 & 88.7263862345502 \tabularnewline
14 & 107.248613071676 \tabularnewline
15 & 113.581604995546 \tabularnewline
16 & 137.298051000995 \tabularnewline
17 & 159.317859707047 \tabularnewline
18 & 153.275517736675 \tabularnewline
19 & 297.454571234322 \tabularnewline
\hline
\end{tabular}
%Source: https://freestatistics.org/blog/index.php?pk=23404&T=2

[TABLE]
[ROW][C]Summary of Cut Dendrogram[/C][/ROW]
[ROW][C]Label[/C][C]Height[/C][/ROW]
[ROW][C]1[/C][C]68.8546603422424[/C][/ROW]
[ROW][C]2[/C][C]69.990417748164[/C][/ROW]
[ROW][C]3[/C][C]70.9291223626718[/C][/ROW]
[ROW][C]4[/C][C]76.4701877720257[/C][/ROW]
[ROW][C]5[/C][C]77.4372354901938[/C][/ROW]
[ROW][C]6[/C][C]74.688833757386[/C][/ROW]
[ROW][C]7[/C][C]87.089462301966[/C][/ROW]
[ROW][C]8[/C][C]93.9318944815338[/C][/ROW]
[ROW][C]9[/C][C]98.9156089624366[/C][/ROW]
[ROW][C]10[/C][C]94.1152061038833[/C][/ROW]
[ROW][C]11[/C][C]102.667463150242[/C][/ROW]
[ROW][C]12[/C][C]92.0163478349846[/C][/ROW]
[ROW][C]13[/C][C]88.7263862345502[/C][/ROW]
[ROW][C]14[/C][C]107.248613071676[/C][/ROW]
[ROW][C]15[/C][C]113.581604995546[/C][/ROW]
[ROW][C]16[/C][C]137.298051000995[/C][/ROW]
[ROW][C]17[/C][C]159.317859707047[/C][/ROW]
[ROW][C]18[/C][C]153.275517736675[/C][/ROW]
[ROW][C]19[/C][C]297.454571234322[/C][/ROW]
[/TABLE]
Source: https://freestatistics.org/blog/index.php?pk=23404&T=2

Globally Unique Identifier (entire table): ba.freestatistics.org/blog/index.php?pk=23404&T=2

As an alternative you can also use a QR Code:  

The GUIDs for individual cells are displayed in the table below:

Summary of Cut Dendrogram
LabelHeight
168.8546603422424
269.990417748164
370.9291223626718
476.4701877720257
577.4372354901938
674.688833757386
787.089462301966
893.9318944815338
998.9156089624366
1094.1152061038833
11102.667463150242
1292.0163478349846
1388.7263862345502
14107.248613071676
15113.581604995546
16137.298051000995
17159.317859707047
18153.275517736675
19297.454571234322


Parameters (Session):
par1 = median ; par2 = 20 ; par3 = FALSE ; par4 = FALSE ;
Parameters (R input):
par1 = median ; par2 = 20 ; par3 = FALSE ; par4 = FALSE ;
R code (references can be found in the software module):
par3 <- as.logical(par3)
par4 <- as.logical(par4)
if (par3 == 'TRUE'){
dum = xlab
xlab = ylab
ylab = dum
}
x <- t(y)
hc <- hclust(dist(x),method=par1)
d <- as.dendrogram(hc)
str(d)
mysub <- paste('Method: ',par1)
bitmap(file='test1.png')
if (par4 == 'TRUE'){
plot(d,main=main,ylab=ylab,xlab=xlab,horiz=par3, nodePar=list(pch = c(1,NA), cex=0.8, lab.cex = 0.8),type='t',center=T, sub=mysub)
} else {
plot(d,main=main,ylab=ylab,xlab=xlab,horiz=par3, nodePar=list(pch = c(1,NA), cex=0.8, lab.cex = 0.8), sub=mysub)
}
dev.off()
if (par2 != 'ALL'){
if (par3 == 'TRUE'){
ylab = 'cluster'
} else {
xlab = 'cluster'
}
par2 <- as.numeric(par2)
memb <- cutree(hc, k = par2)
cent <- NULL
for(k in 1:par2){
cent <- rbind(cent, colMeans(x[memb == k, , drop = FALSE]))
}
hc1 <- hclust(dist(cent),method=par1, members = table(memb))
de <- as.dendrogram(hc1)
bitmap(file='test2.png')
if (par4 == 'TRUE'){
plot(de,main=main,ylab=ylab,xlab=xlab,horiz=par3, nodePar=list(pch = c(1,NA), cex=0.8, lab.cex = 0.8),type='t',center=T, sub=mysub)
} else {
plot(de,main=main,ylab=ylab,xlab=xlab,horiz=par3, nodePar=list(pch = c(1,NA), cex=0.8, lab.cex = 0.8), sub=mysub)
}
dev.off()
str(de)
}
load(file='createtable')
a<-table.start()
a<-table.row.start(a)
a<-table.element(a,'Summary of Dendrogram',2,TRUE)
a<-table.row.end(a)
a<-table.row.start(a)
a<-table.element(a,'Label',header=TRUE)
a<-table.element(a,'Height',header=TRUE)
a<-table.row.end(a)
num <- length(x[,1])-1
for (i in 1:num)
{
a<-table.row.start(a)
a<-table.element(a,hc$labels[i])
a<-table.element(a,hc$height[i])
a<-table.row.end(a)
}
a<-table.end(a)
table.save(a,file='mytable1.tab')
if (par2 != 'ALL'){
a<-table.start()
a<-table.row.start(a)
a<-table.element(a,'Summary of Cut Dendrogram',2,TRUE)
a<-table.row.end(a)
a<-table.row.start(a)
a<-table.element(a,'Label',header=TRUE)
a<-table.element(a,'Height',header=TRUE)
a<-table.row.end(a)
num <- par2-1
for (i in 1:num)
{
a<-table.row.start(a)
a<-table.element(a,i)
a<-table.element(a,hc1$height[i])
a<-table.row.end(a)
}
a<-table.end(a)
table.save(a,file='mytable2.tab')
}