Free Statistics

of Irreproducible Research!

Author's title

Author*The author of this computation has been verified*
R Software Modulerwasp_hierarchicalclustering.wasp
Title produced by softwareHierarchical Clustering
Date of computationTue, 11 Nov 2008 05:30:04 -0700
Cite this page as followsStatistical Computations at FreeStatistics.org, Office for Research Development and Education, URL https://freestatistics.org/blog/index.php?v=date/2008/Nov/11/t12264066651cgmnqmnmq1960v.htm/, Retrieved Sun, 19 May 2024 08:52:07 +0000
Statistical Computations at FreeStatistics.org, Office for Research Development and Education, URL https://freestatistics.org/blog/index.php?pk=23387, Retrieved Sun, 19 May 2024 08:52:07 +0000
QR Codes:

Original text written by user:
IsPrivate?No (this computation is public)
User-defined keywords
Estimated Impact135
Family? (F = Feedback message, R = changed R code, M = changed R Module, P = changed Parameters, D = changed Data)
F       [Hierarchical Clustering] [Q2 Hierarchical C...] [2008-11-11 12:30:04] [21d7d81e7693ad6dde5aadefb1046611] [Current]
Feedback Forum
2008-11-23 13:20:08 [339a57d8a4d5d113e4804fc423e4a59e] [reply
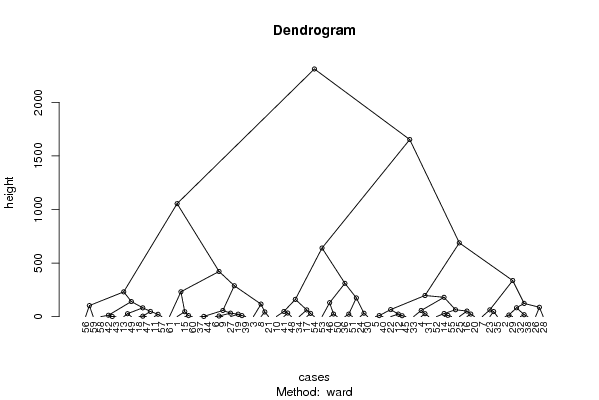
De student heeft hier de software voor clustering toegepast. Dit is inderdaad correct. Hiermee gaat men groepjes samenvoegen onder een tak. Clustering wordt echter niet veel gebruikt voor tijdreeksen. De student heeft achter geen analyse gemaakt. In casu kan men stellen dat de vertakkingen toch in een bepaald wederkerend patroon tevoorschijn komen.
2008-11-24 13:26:08 [Ellen Smolders] [reply
De student heeft de juiste berekeningen gemaakt zodat we komen op de Dendrogram. Deze grafiek heeft een boomstructuur, en geeft alle observaties weer. Deze observaties vallen steeds uiteen en kunnen we groeperen in verschillende categoriën. De observaties blijven zich onderverdelen totdat we uitkomen op een cluster van telkens één observatie. Met deze grafiek kunnen we zeer duidelijk zien welke observaties gelijkaardig zijn, we kunnen trends onderzoeken. Deze grafiek wordt meestal gebruikt voor niet-tijdreeksen, bv. marketinggegevens.
2008-11-24 13:26:32 [Ellen Smolders] [reply
We kunnen vaststellen dat de dendrogram een bepaald wederkerend patroon vertoont.

Post a new message
Dataseries X:
604.4	882.5	1.1663
883.9	789.6	1.1372
527.9	773.3	1.1139
756.2	804.3	1.1222
812.9	817.8	1.1692
655.6	836.7	1.1702
707.6	721.8	1.2286
612.6	760.8	1.2613
659.2	841.4	1.2646
833.4	1045.6	1.2262
727.8	949.2	1.1985
797.2	850.1	1.2007
753	957.4	1.2138
762	851.8	1.2266
613.7	913.9	1.2176
759.2	888	1.2218
816.4	973.8	1.249
736.8	927.6	1.2991
680.1	833	1.3408
736.5	879.5	1.3119
637.2	797.3	1.3014
801.9	834.5	1.3201
772.3	735.1	1.2938
897.3	835	1.2694
792.1	892.8	1.2165
826.8	697.2	1.2037
666.8	821.1	1.2292
906.6	732.7	1.2256
871.4	797.6	1.2015
891	866.3	1.1786
739.2	826.3	1.1856
833.6	778.6	1.2103
715.6	779.2	1.1938
871.6	951	1.202
751.6	692.3	1.2271
1005.5	841.4	1.277
681.2	857.3	1.265
837.3	760.7	1.2684
674.7	841.2	1.2811
806.3	810.3	1.2727
860.2	1007.4	1.2611
689.8	931.3	1.2881
691.6	931.2	1.3213
682.6	855.8	1.2999
800.1	858.4	1.3074
1023.7	925.9	1.3242
733.5	930.7	1.3516
875.3	1037.6	1.3511
770.2	979.2	1.3419
1005.7	942.6	1.3716
982.3	843.9	1.3622
742.9	854.3	1.3896
974.2	1029.8	1.4227
822.3	944	1.4684
773.2	856.4	1.457
750.9	1059.4	1.4718
708	959.3	1.4748
690	941.5	1.5527
652.8	1026.4	1.575
620.7	921.3	1.5557
461.9	968	1.5553


Summary of computational transaction
Raw Inputview raw input (R code)
Raw Outputview raw output of R engine
Computing time3 seconds
R Server'George Udny Yule' @ 72.249.76.132

\begin{tabular}{lllllllll}
\hline
Summary of computational transaction \tabularnewline
Raw Input & view raw input (R code)  \tabularnewline
Raw Output & view raw output of R engine  \tabularnewline
Computing time & 3 seconds \tabularnewline
R Server & 'George Udny Yule' @ 72.249.76.132 \tabularnewline
\hline
\end{tabular}
%Source: https://freestatistics.org/blog/index.php?pk=23387&T=0

[TABLE]
[ROW][C]Summary of computational transaction[/C][/ROW]
[ROW][C]Raw Input[/C][C]view raw input (R code) [/C][/ROW]
[ROW][C]Raw Output[/C][C]view raw output of R engine [/C][/ROW]
[ROW][C]Computing time[/C][C]3 seconds[/C][/ROW]
[ROW][C]R Server[/C][C]'George Udny Yule' @ 72.249.76.132[/C][/ROW]
[/TABLE]
Source: https://freestatistics.org/blog/index.php?pk=23387&T=0

Globally Unique Identifier (entire table): ba.freestatistics.org/blog/index.php?pk=23387&T=0

As an alternative you can also use a QR Code:  

The GUIDs for individual cells are displayed in the table below:

Summary of computational transaction
Raw Inputview raw input (R code)
Raw Outputview raw output of R engine
Computing time3 seconds
R Server'George Udny Yule' @ 72.249.76.132


Summary of Dendrogram
LabelHeight
11.80308131818846
22.05212524227931
34.52799693573216
45.92105660841032
58.79268928656069
69.8185316667005
79.9910315908819
810.1918747838658
912.1100406341185
1013.153299991119
1114.8409613735095
1218.2784948945475
1322.2289527798769
1423.0229818483905
1523.3344650472215
1623.9096127856506
1724.2393918655151
1824.5538641920167
1927.7686227532084
2027.802949835584
2129.0542312906118
2230.3792385743948
2331.9278600072100
2432.6340692427732
2533.764746408051
2644.01603807716
2746.4926546746156
2847.5429747585277
2948.2921237883491
3048.5744700962832
3152.1982017231678
3257.6750894334328
3357.8105327173876
3462.8859677923717
3563.5036351292274
3664.4234420484223
3765.8858157066221
3882.3958819161652
3982.8768320976705
4087.340085182063
41103.501790565381
42117.009067808070
43123.305139395024
44130.351431687277
45141.177131547455
46160.903756066627
47174.887817838757
48180.421639021395
49197.401471420562
50231.280945140610
51232.258669832457
52288.651833982406
53310.712496208711
54336.878154464803
55421.693133088249
56640.357071732618
57688.354957497548
581054.20091656874
591652.17885460388
602310.68590499412

\begin{tabular}{lllllllll}
\hline
Summary of Dendrogram \tabularnewline
Label & Height \tabularnewline
1 & 1.80308131818846 \tabularnewline
2 & 2.05212524227931 \tabularnewline
3 & 4.52799693573216 \tabularnewline
4 & 5.92105660841032 \tabularnewline
5 & 8.79268928656069 \tabularnewline
6 & 9.8185316667005 \tabularnewline
7 & 9.9910315908819 \tabularnewline
8 & 10.1918747838658 \tabularnewline
9 & 12.1100406341185 \tabularnewline
10 & 13.153299991119 \tabularnewline
11 & 14.8409613735095 \tabularnewline
12 & 18.2784948945475 \tabularnewline
13 & 22.2289527798769 \tabularnewline
14 & 23.0229818483905 \tabularnewline
15 & 23.3344650472215 \tabularnewline
16 & 23.9096127856506 \tabularnewline
17 & 24.2393918655151 \tabularnewline
18 & 24.5538641920167 \tabularnewline
19 & 27.7686227532084 \tabularnewline
20 & 27.802949835584 \tabularnewline
21 & 29.0542312906118 \tabularnewline
22 & 30.3792385743948 \tabularnewline
23 & 31.9278600072100 \tabularnewline
24 & 32.6340692427732 \tabularnewline
25 & 33.764746408051 \tabularnewline
26 & 44.01603807716 \tabularnewline
27 & 46.4926546746156 \tabularnewline
28 & 47.5429747585277 \tabularnewline
29 & 48.2921237883491 \tabularnewline
30 & 48.5744700962832 \tabularnewline
31 & 52.1982017231678 \tabularnewline
32 & 57.6750894334328 \tabularnewline
33 & 57.8105327173876 \tabularnewline
34 & 62.8859677923717 \tabularnewline
35 & 63.5036351292274 \tabularnewline
36 & 64.4234420484223 \tabularnewline
37 & 65.8858157066221 \tabularnewline
38 & 82.3958819161652 \tabularnewline
39 & 82.8768320976705 \tabularnewline
40 & 87.340085182063 \tabularnewline
41 & 103.501790565381 \tabularnewline
42 & 117.009067808070 \tabularnewline
43 & 123.305139395024 \tabularnewline
44 & 130.351431687277 \tabularnewline
45 & 141.177131547455 \tabularnewline
46 & 160.903756066627 \tabularnewline
47 & 174.887817838757 \tabularnewline
48 & 180.421639021395 \tabularnewline
49 & 197.401471420562 \tabularnewline
50 & 231.280945140610 \tabularnewline
51 & 232.258669832457 \tabularnewline
52 & 288.651833982406 \tabularnewline
53 & 310.712496208711 \tabularnewline
54 & 336.878154464803 \tabularnewline
55 & 421.693133088249 \tabularnewline
56 & 640.357071732618 \tabularnewline
57 & 688.354957497548 \tabularnewline
58 & 1054.20091656874 \tabularnewline
59 & 1652.17885460388 \tabularnewline
60 & 2310.68590499412 \tabularnewline
\hline
\end{tabular}
%Source: https://freestatistics.org/blog/index.php?pk=23387&T=1

[TABLE]
[ROW][C]Summary of Dendrogram[/C][/ROW]
[ROW][C]Label[/C][C]Height[/C][/ROW]
[ROW][C]1[/C][C]1.80308131818846[/C][/ROW]
[ROW][C]2[/C][C]2.05212524227931[/C][/ROW]
[ROW][C]3[/C][C]4.52799693573216[/C][/ROW]
[ROW][C]4[/C][C]5.92105660841032[/C][/ROW]
[ROW][C]5[/C][C]8.79268928656069[/C][/ROW]
[ROW][C]6[/C][C]9.8185316667005[/C][/ROW]
[ROW][C]7[/C][C]9.9910315908819[/C][/ROW]
[ROW][C]8[/C][C]10.1918747838658[/C][/ROW]
[ROW][C]9[/C][C]12.1100406341185[/C][/ROW]
[ROW][C]10[/C][C]13.153299991119[/C][/ROW]
[ROW][C]11[/C][C]14.8409613735095[/C][/ROW]
[ROW][C]12[/C][C]18.2784948945475[/C][/ROW]
[ROW][C]13[/C][C]22.2289527798769[/C][/ROW]
[ROW][C]14[/C][C]23.0229818483905[/C][/ROW]
[ROW][C]15[/C][C]23.3344650472215[/C][/ROW]
[ROW][C]16[/C][C]23.9096127856506[/C][/ROW]
[ROW][C]17[/C][C]24.2393918655151[/C][/ROW]
[ROW][C]18[/C][C]24.5538641920167[/C][/ROW]
[ROW][C]19[/C][C]27.7686227532084[/C][/ROW]
[ROW][C]20[/C][C]27.802949835584[/C][/ROW]
[ROW][C]21[/C][C]29.0542312906118[/C][/ROW]
[ROW][C]22[/C][C]30.3792385743948[/C][/ROW]
[ROW][C]23[/C][C]31.9278600072100[/C][/ROW]
[ROW][C]24[/C][C]32.6340692427732[/C][/ROW]
[ROW][C]25[/C][C]33.764746408051[/C][/ROW]
[ROW][C]26[/C][C]44.01603807716[/C][/ROW]
[ROW][C]27[/C][C]46.4926546746156[/C][/ROW]
[ROW][C]28[/C][C]47.5429747585277[/C][/ROW]
[ROW][C]29[/C][C]48.2921237883491[/C][/ROW]
[ROW][C]30[/C][C]48.5744700962832[/C][/ROW]
[ROW][C]31[/C][C]52.1982017231678[/C][/ROW]
[ROW][C]32[/C][C]57.6750894334328[/C][/ROW]
[ROW][C]33[/C][C]57.8105327173876[/C][/ROW]
[ROW][C]34[/C][C]62.8859677923717[/C][/ROW]
[ROW][C]35[/C][C]63.5036351292274[/C][/ROW]
[ROW][C]36[/C][C]64.4234420484223[/C][/ROW]
[ROW][C]37[/C][C]65.8858157066221[/C][/ROW]
[ROW][C]38[/C][C]82.3958819161652[/C][/ROW]
[ROW][C]39[/C][C]82.8768320976705[/C][/ROW]
[ROW][C]40[/C][C]87.340085182063[/C][/ROW]
[ROW][C]41[/C][C]103.501790565381[/C][/ROW]
[ROW][C]42[/C][C]117.009067808070[/C][/ROW]
[ROW][C]43[/C][C]123.305139395024[/C][/ROW]
[ROW][C]44[/C][C]130.351431687277[/C][/ROW]
[ROW][C]45[/C][C]141.177131547455[/C][/ROW]
[ROW][C]46[/C][C]160.903756066627[/C][/ROW]
[ROW][C]47[/C][C]174.887817838757[/C][/ROW]
[ROW][C]48[/C][C]180.421639021395[/C][/ROW]
[ROW][C]49[/C][C]197.401471420562[/C][/ROW]
[ROW][C]50[/C][C]231.280945140610[/C][/ROW]
[ROW][C]51[/C][C]232.258669832457[/C][/ROW]
[ROW][C]52[/C][C]288.651833982406[/C][/ROW]
[ROW][C]53[/C][C]310.712496208711[/C][/ROW]
[ROW][C]54[/C][C]336.878154464803[/C][/ROW]
[ROW][C]55[/C][C]421.693133088249[/C][/ROW]
[ROW][C]56[/C][C]640.357071732618[/C][/ROW]
[ROW][C]57[/C][C]688.354957497548[/C][/ROW]
[ROW][C]58[/C][C]1054.20091656874[/C][/ROW]
[ROW][C]59[/C][C]1652.17885460388[/C][/ROW]
[ROW][C]60[/C][C]2310.68590499412[/C][/ROW]
[/TABLE]
Source: https://freestatistics.org/blog/index.php?pk=23387&T=1

Globally Unique Identifier (entire table): ba.freestatistics.org/blog/index.php?pk=23387&T=1

As an alternative you can also use a QR Code:  

The GUIDs for individual cells are displayed in the table below:

Summary of Dendrogram
LabelHeight
11.80308131818846
22.05212524227931
34.52799693573216
45.92105660841032
58.79268928656069
69.8185316667005
79.9910315908819
810.1918747838658
912.1100406341185
1013.153299991119
1114.8409613735095
1218.2784948945475
1322.2289527798769
1423.0229818483905
1523.3344650472215
1623.9096127856506
1724.2393918655151
1824.5538641920167
1927.7686227532084
2027.802949835584
2129.0542312906118
2230.3792385743948
2331.9278600072100
2432.6340692427732
2533.764746408051
2644.01603807716
2746.4926546746156
2847.5429747585277
2948.2921237883491
3048.5744700962832
3152.1982017231678
3257.6750894334328
3357.8105327173876
3462.8859677923717
3563.5036351292274
3664.4234420484223
3765.8858157066221
3882.3958819161652
3982.8768320976705
4087.340085182063
41103.501790565381
42117.009067808070
43123.305139395024
44130.351431687277
45141.177131547455
46160.903756066627
47174.887817838757
48180.421639021395
49197.401471420562
50231.280945140610
51232.258669832457
52288.651833982406
53310.712496208711
54336.878154464803
55421.693133088249
56640.357071732618
57688.354957497548
581054.20091656874
591652.17885460388
602310.68590499412


Parameters (Session):
par1 = ward ; par2 = ALL ; par3 = FALSE ; par4 = TRUE ;
Parameters (R input):
par1 = ward ; par2 = ALL ; par3 = FALSE ; par4 = TRUE ;
R code (references can be found in the software module):
par3 <- as.logical(par3)
par4 <- as.logical(par4)
if (par3 == 'TRUE'){
dum = xlab
xlab = ylab
ylab = dum
}
x <- t(y)
hc <- hclust(dist(x),method=par1)
d <- as.dendrogram(hc)
str(d)
mysub <- paste('Method: ',par1)
bitmap(file='test1.png')
if (par4 == 'TRUE'){
plot(d,main=main,ylab=ylab,xlab=xlab,horiz=par3, nodePar=list(pch = c(1,NA), cex=0.8, lab.cex = 0.8),type='t',center=T, sub=mysub)
} else {
plot(d,main=main,ylab=ylab,xlab=xlab,horiz=par3, nodePar=list(pch = c(1,NA), cex=0.8, lab.cex = 0.8), sub=mysub)
}
dev.off()
if (par2 != 'ALL'){
if (par3 == 'TRUE'){
ylab = 'cluster'
} else {
xlab = 'cluster'
}
par2 <- as.numeric(par2)
memb <- cutree(hc, k = par2)
cent <- NULL
for(k in 1:par2){
cent <- rbind(cent, colMeans(x[memb == k, , drop = FALSE]))
}
hc1 <- hclust(dist(cent),method=par1, members = table(memb))
de <- as.dendrogram(hc1)
bitmap(file='test2.png')
if (par4 == 'TRUE'){
plot(de,main=main,ylab=ylab,xlab=xlab,horiz=par3, nodePar=list(pch = c(1,NA), cex=0.8, lab.cex = 0.8),type='t',center=T, sub=mysub)
} else {
plot(de,main=main,ylab=ylab,xlab=xlab,horiz=par3, nodePar=list(pch = c(1,NA), cex=0.8, lab.cex = 0.8), sub=mysub)
}
dev.off()
str(de)
}
load(file='createtable')
a<-table.start()
a<-table.row.start(a)
a<-table.element(a,'Summary of Dendrogram',2,TRUE)
a<-table.row.end(a)
a<-table.row.start(a)
a<-table.element(a,'Label',header=TRUE)
a<-table.element(a,'Height',header=TRUE)
a<-table.row.end(a)
num <- length(x[,1])-1
for (i in 1:num)
{
a<-table.row.start(a)
a<-table.element(a,hc$labels[i])
a<-table.element(a,hc$height[i])
a<-table.row.end(a)
}
a<-table.end(a)
table.save(a,file='mytable1.tab')
if (par2 != 'ALL'){
a<-table.start()
a<-table.row.start(a)
a<-table.element(a,'Summary of Cut Dendrogram',2,TRUE)
a<-table.row.end(a)
a<-table.row.start(a)
a<-table.element(a,'Label',header=TRUE)
a<-table.element(a,'Height',header=TRUE)
a<-table.row.end(a)
num <- par2-1
for (i in 1:num)
{
a<-table.row.start(a)
a<-table.element(a,i)
a<-table.element(a,hc1$height[i])
a<-table.row.end(a)
}
a<-table.end(a)
table.save(a,file='mytable2.tab')
}