Free Statistics

of Irreproducible Research!

Author's title

Author*Unverified author*
R Software Modulerwasp_boxcoxlin.wasp
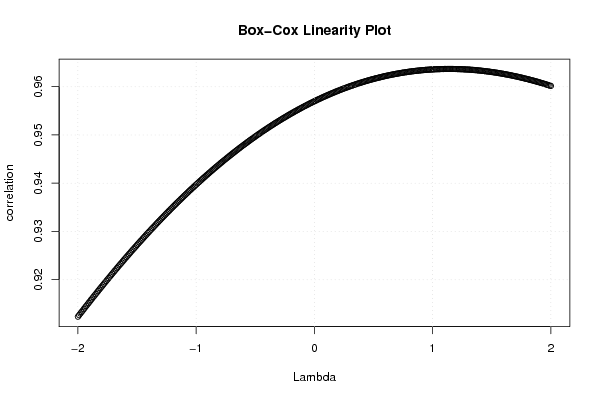
Title produced by softwareBox-Cox Linearity Plot
Date of computationTue, 11 Nov 2008 04:57:54 -0700
Cite this page as followsStatistical Computations at FreeStatistics.org, Office for Research Development and Education, URL https://freestatistics.org/blog/index.php?v=date/2008/Nov/11/t12264047150kzdxscae0uw4d7.htm/, Retrieved Sun, 19 May 2024 12:15:47 +0000
Statistical Computations at FreeStatistics.org, Office for Research Development and Education, URL https://freestatistics.org/blog/index.php?pk=23348, Retrieved Sun, 19 May 2024 12:15:47 +0000
QR Codes:

Original text written by user:
IsPrivate?No (this computation is public)
User-defined keywords
Estimated Impact136
Family? (F = Feedback message, R = changed R code, M = changed R Module, P = changed Parameters, D = changed Data)
F     [Partial Correlation] [Partial Correlation ] [2008-11-11 10:49:03] [252acdb58d8522ab27f61fa1e87b5efe]
F RM D    [Box-Cox Linearity Plot] [Box-Cox transform...] [2008-11-11 11:57:54] [54e3d3004a715f41ac868f539d95466f] [Current]
Feedback Forum
2008-11-19 13:00:05 [Bob Leysen] [reply
De link is correct.

Er is een correlatie van 0,9636775 tussen de 2 reeksen.
Er is zeer weinig verschil met voor en na de transformatie.

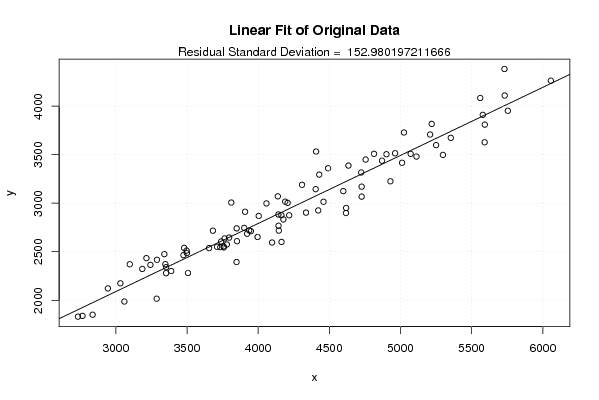
Voor (originial): 152,98019
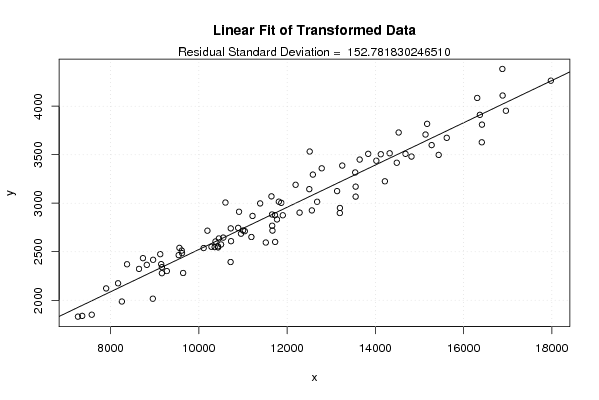
Na (transformed): 152,78183

Als je naar de y-as van de box-cox linearity plot kijkt, zie je dat de correlatiewaarden niet al te veel verschillen wanneer de lambda-waarden worden getransformeerd. Is deze techniek dan wel nuttig?

Post a new message
Dataseries X:
3353
3480
3098
2944
3389
3497
4404
3849
3734
3060
3507
3287
3215
3764
2734
2837
2766
3851
3289
3848
3348
3682
4058
3655
3811
3341
3032
3475
3353
3186
3902
4164
3499
4145
3796
3711
3949
3740
3243
4407
4814
3908
5250
3937
4004
5560
3922
3759
4138
4634
3996
4308
4142
4429
5219
4929
5754
5592
4163
4962
5208
4755
4491
5732
5730
5024
6056
4901
5353
5578
4618
4724
5011
5298
4143
4617
4727
4207
5112
4190
4098
5071
4177
4598
3757
5591
4218
3780
4336
4870
4422
4727
4459
Dataseries Y:
2341
2540
2371
2122
2301
2512
3145
2741
2548
1987
2281
2016
2434
2637
1831
1851
1839
2609
2417
2394
2372
2717
2998
2538
3007
2475
2175
2465
2279
2323
2746
2601
2486
2718
2646
2551
2712
2606
2365
3533
3509
2912
3599
2719
2869
4085
2686
2545
3071
3388
2652
3190
2884
3295
3818
3226
3953
3810
2877
3515
3708
3450
3360
4110
4384
3729
4263
3505
3674
3911
2951
3317
3417
3498
2768
2899
3171
3004
3481
3016
2595
3509
2833
3125
2556
3628
2876
2575
2903
3438
2926
3068
3015


Summary of computational transaction
Raw Inputview raw input (R code)
Raw Outputview raw output of R engine
Computing time1 seconds
R Server'Gwilym Jenkins' @ 72.249.127.135

\begin{tabular}{lllllllll}
\hline
Summary of computational transaction \tabularnewline
Raw Input & view raw input (R code)  \tabularnewline
Raw Output & view raw output of R engine  \tabularnewline
Computing time & 1 seconds \tabularnewline
R Server & 'Gwilym Jenkins' @ 72.249.127.135 \tabularnewline
\hline
\end{tabular}
%Source: https://freestatistics.org/blog/index.php?pk=23348&T=0

[TABLE]
[ROW][C]Summary of computational transaction[/C][/ROW]
[ROW][C]Raw Input[/C][C]view raw input (R code) [/C][/ROW]
[ROW][C]Raw Output[/C][C]view raw output of R engine [/C][/ROW]
[ROW][C]Computing time[/C][C]1 seconds[/C][/ROW]
[ROW][C]R Server[/C][C]'Gwilym Jenkins' @ 72.249.127.135[/C][/ROW]
[/TABLE]
Source: https://freestatistics.org/blog/index.php?pk=23348&T=0

Globally Unique Identifier (entire table): ba.freestatistics.org/blog/index.php?pk=23348&T=0

As an alternative you can also use a QR Code:  

The GUIDs for individual cells are displayed in the table below:

Summary of computational transaction
Raw Inputview raw input (R code)
Raw Outputview raw output of R engine
Computing time1 seconds
R Server'Gwilym Jenkins' @ 72.249.127.135


Box-Cox Linearity Plot
# observations x93
maximum correlation0.963677506282265
optimal lambda(x)1.14
Residual SD (orginial)152.980197211666
Residual SD (transformed)152.781830246510

\begin{tabular}{lllllllll}
\hline
Box-Cox Linearity Plot \tabularnewline
# observations x & 93 \tabularnewline
maximum correlation & 0.963677506282265 \tabularnewline
optimal lambda(x) & 1.14 \tabularnewline
Residual SD (orginial) & 152.980197211666 \tabularnewline
Residual SD (transformed) & 152.781830246510 \tabularnewline
\hline
\end{tabular}
%Source: https://freestatistics.org/blog/index.php?pk=23348&T=1

[TABLE]
[ROW][C]Box-Cox Linearity Plot[/C][/ROW]
[ROW][C]# observations x[/C][C]93[/C][/ROW]
[ROW][C]maximum correlation[/C][C]0.963677506282265[/C][/ROW]
[ROW][C]optimal lambda(x)[/C][C]1.14[/C][/ROW]
[ROW][C]Residual SD (orginial)[/C][C]152.980197211666[/C][/ROW]
[ROW][C]Residual SD (transformed)[/C][C]152.781830246510[/C][/ROW]
[/TABLE]
Source: https://freestatistics.org/blog/index.php?pk=23348&T=1

Globally Unique Identifier (entire table): ba.freestatistics.org/blog/index.php?pk=23348&T=1

As an alternative you can also use a QR Code:  

The GUIDs for individual cells are displayed in the table below:

Box-Cox Linearity Plot
# observations x93
maximum correlation0.963677506282265
optimal lambda(x)1.14
Residual SD (orginial)152.980197211666
Residual SD (transformed)152.781830246510


Parameters (Session):
Parameters (R input):
R code (references can be found in the software module):
n <- length(x)
c <- array(NA,dim=c(401))
l <- array(NA,dim=c(401))
mx <- 0
mxli <- -999
for (i in 1:401)
{
l[i] <- (i-201)/100
if (l[i] != 0)
{
x1 <- (x^l[i] - 1) / l[i]
} else {
x1 <- log(x)
}
c[i] <- cor(x1,y)
if (mx < abs(c[i]))
{
mx <- abs(c[i])
mxli <- l[i]
}
}
c
mx
mxli
if (mxli != 0)
{
x1 <- (x^mxli - 1) / mxli
} else {
x1 <- log(x)
}
r<-lm(y~x)
se <- sqrt(var(r$residuals))
r1 <- lm(y~x1)
se1 <- sqrt(var(r1$residuals))
bitmap(file='test1.png')
plot(l,c,main='Box-Cox Linearity Plot',xlab='Lambda',ylab='correlation')
grid()
dev.off()
bitmap(file='test2.png')
plot(x,y,main='Linear Fit of Original Data',xlab='x',ylab='y')
abline(r)
grid()
mtext(paste('Residual Standard Deviation = ',se))
dev.off()
bitmap(file='test3.png')
plot(x1,y,main='Linear Fit of Transformed Data',xlab='x',ylab='y')
abline(r1)
grid()
mtext(paste('Residual Standard Deviation = ',se1))
dev.off()
load(file='createtable')
a<-table.start()
a<-table.row.start(a)
a<-table.element(a,'Box-Cox Linearity Plot',2,TRUE)
a<-table.row.end(a)
a<-table.row.start(a)
a<-table.element(a,'# observations x',header=TRUE)
a<-table.element(a,n)
a<-table.row.end(a)
a<-table.row.start(a)
a<-table.element(a,'maximum correlation',header=TRUE)
a<-table.element(a,mx)
a<-table.row.end(a)
a<-table.row.start(a)
a<-table.element(a,'optimal lambda(x)',header=TRUE)
a<-table.element(a,mxli)
a<-table.row.end(a)
a<-table.row.start(a)
a<-table.element(a,'Residual SD (orginial)',header=TRUE)
a<-table.element(a,se)
a<-table.row.end(a)
a<-table.row.start(a)
a<-table.element(a,'Residual SD (transformed)',header=TRUE)
a<-table.element(a,se1)
a<-table.row.end(a)
a<-table.end(a)
table.save(a,file='mytable.tab')