Free Statistics

of Irreproducible Research!

Author's title

Author*Unverified author*
R Software Modulerwasp_fitdistrnorm.wasp
Title produced by softwareMaximum-likelihood Fitting - Normal Distribution
Date of computationTue, 11 Nov 2008 04:28:03 -0700
Cite this page as followsStatistical Computations at FreeStatistics.org, Office for Research Development and Education, URL https://freestatistics.org/blog/index.php?v=date/2008/Nov/11/t1226402922v4pqfba70dy9jnd.htm/, Retrieved Sun, 19 May 2024 09:21:09 +0000
Statistical Computations at FreeStatistics.org, Office for Research Development and Education, URL https://freestatistics.org/blog/index.php?pk=23330, Retrieved Sun, 19 May 2024 09:21:09 +0000
QR Codes:

Original text written by user:
IsPrivate?No (this computation is public)
User-defined keywords
Estimated Impact173
Family? (F = Feedback message, R = changed R code, M = changed R Module, P = changed Parameters, D = changed Data)
F       [Maximum-likelihood Fitting - Normal Distribution] [Maximum-likelihoo...] [2008-11-11 11:28:03] [3b916296c2d2371d528ff188880e3d2b] [Current]
F   PD    [Maximum-likelihood Fitting - Normal Distribution] [histogram] [2008-11-12 18:59:17] [762cc4d66bc29c3c2c407be34c6d0239]
F    D    [Maximum-likelihood Fitting - Normal Distribution] [maximum-likelihoo...] [2008-11-13 16:13:29] [0e5eff269cdcaf8789c45b6ee36b0c3d]
Feedback Forum
2008-11-22 14:03:49 [An Knapen] [reply
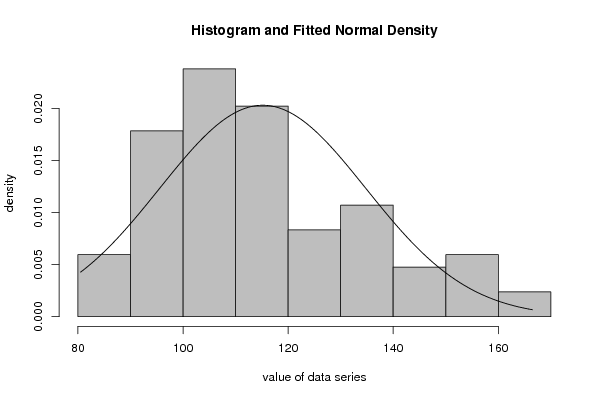
De normaalverdeling is inderdaad geen goede benadering voor Yt. We kunnen afleiden dat de verdeling rechtsscheef is. Dit zie je aan de staart die merkbaar is aan de rechterkant.
2008-11-23 14:12:29 [Nathalie Daneels] [reply
Evaluatie opdracht 3 - Blok 8 (Q5)

De student zou bij deze vraag ook de tabel met het geschatte gemiddelde en de geschatte standdaarddeviatie erbij moeten zetten.
Vervolgens zou de conclusie nog moeten aangevuld worden met het volgende:

De Maximum-likelihood estimation (maximum waarschijnlijkheidsschatting) begint met de wiskundige uitdrukking, gekend als een waarschijnlijkheidsfunctie van de steekproefgegevens. Globaal gezien is de waarschijnlijkheid van een reeks gegevens, de kans/waarschijnlijkheid dat je juist die reeks van gegevens verkrijgt, gezien het gekozen waarschijnlijkheidsmodel. Deze uitdrukking bevat de onbekende parameters. Die waarden van de parameter, die de steekproefwaarschijnlijkheid maximaliseren, zijn gekend als de maximum likelihood estimates (de maximum waarschijnlijkheidschattingen).

Wat ik hierboven heb beschreven, is de theorie uit EDA. De conclusie zou ook het volgende moeten bevatten:

De software maakt een schatting van het gemiddelde en de standaardfout die het best past bij de verdeling van de gegevens. In de grafiek zie je dan ook de geschatte normaalverdeling die het dichtst bij het histogram aanleunt.
Bij de tabel moeten we enkel kijken naar de estimated value van de mean en de standard deviation.
De tweede kolom geeft eigenlijk de standaarddeviatie van het geschatte gemiddelde en de standaarddeviatie van de geschatte standaarddeviatie, maar dit wordt hier verder buiten beschouwing gelaten.
Uit de tabel kunnen we het geschatte gemiddelde (115,16) en standaarddeviatie (19,63) afleiden. De lijn, die op de grafiek is getekend, vormt de geschatte normaalverdeling die het dichtst bij het histogram aanleunt. Bij een normaalverdeling bevindt het gemiddelde zich meestal in het midden van het histogram, wat we bij deze figuur niet echt kunnen beamen: Het is duidelijk dat het histogram rechts scheef verdeeld is. Dit houdt in dat het gemiddelde links van de mediaan ligt (Bij een normaalverdeling is het gemiddelde gelijk aan de mediaan).

Post a new message
Dataseries X:
93,5
94,7
112,9
99,2
105,6
113
83,1
81,1
96,9
104,3
97,7
102,6
89,9
96
112,7
107,1
106,2
121
101,2
83,2
105,1
113,3
99,1
100,3
93,5
98,8
106,2
98,3
102,1
117,1
101,5
80,5
105,9
109,5
97,2
114,5
93,5
100,9
121,1
116,5
109,3
118,1
108,3
105,4
116,2
111,2
105,8
122,7
99,5
107,9
124,6
115
110,3
132,7
99,7
96,5
118,7
112,9
130,5
137,9
115
116,8
140,9
120,7
134,2
147,3
112,4
107,1
128,4
137,7
135
151
137,4
132,4
161,3
139,8
146
166,5
143,3
121
152,6
154,4
154,6
158


Summary of computational transaction
Raw Inputview raw input (R code)
Raw Outputview raw output of R engine
Computing time2 seconds
R Server'Sir Ronald Aylmer Fisher' @ 193.190.124.24

\begin{tabular}{lllllllll}
\hline
Summary of computational transaction \tabularnewline
Raw Input & view raw input (R code)  \tabularnewline
Raw Output & view raw output of R engine  \tabularnewline
Computing time & 2 seconds \tabularnewline
R Server & 'Sir Ronald Aylmer Fisher' @ 193.190.124.24 \tabularnewline
\hline
\end{tabular}
%Source: https://freestatistics.org/blog/index.php?pk=23330&T=0

[TABLE]
[ROW][C]Summary of computational transaction[/C][/ROW]
[ROW][C]Raw Input[/C][C]view raw input (R code) [/C][/ROW]
[ROW][C]Raw Output[/C][C]view raw output of R engine [/C][/ROW]
[ROW][C]Computing time[/C][C]2 seconds[/C][/ROW]
[ROW][C]R Server[/C][C]'Sir Ronald Aylmer Fisher' @ 193.190.124.24[/C][/ROW]
[/TABLE]
Source: https://freestatistics.org/blog/index.php?pk=23330&T=0

Globally Unique Identifier (entire table): ba.freestatistics.org/blog/index.php?pk=23330&T=0

As an alternative you can also use a QR Code:  

The GUIDs for individual cells are displayed in the table below:

Summary of computational transaction
Raw Inputview raw input (R code)
Raw Outputview raw output of R engine
Computing time2 seconds
R Server'Sir Ronald Aylmer Fisher' @ 193.190.124.24


ParameterEstimated ValueStandard Deviation
mean115.1642857142862.14188181696588
standard deviation19.63067111179141.51453915727673

\begin{tabular}{lllllllll}
\hline
Parameter & Estimated Value & Standard Deviation \tabularnewline
mean & 115.164285714286 & 2.14188181696588 \tabularnewline
standard deviation & 19.6306711117914 & 1.51453915727673 \tabularnewline
\hline
\end{tabular}
%Source: https://freestatistics.org/blog/index.php?pk=23330&T=1

[TABLE]
[ROW][C]Parameter[/C][C]Estimated Value[/C][C]Standard Deviation[/C][/ROW]
[ROW][C]mean[/C][C]115.164285714286[/C][C]2.14188181696588[/C][/ROW]
[ROW][C]standard deviation[/C][C]19.6306711117914[/C][C]1.51453915727673[/C][/ROW]
[/TABLE]
Source: https://freestatistics.org/blog/index.php?pk=23330&T=1

Globally Unique Identifier (entire table): ba.freestatistics.org/blog/index.php?pk=23330&T=1

As an alternative you can also use a QR Code:  

The GUIDs for individual cells are displayed in the table below:

ParameterEstimated ValueStandard Deviation
mean115.1642857142862.14188181696588
standard deviation19.63067111179141.51453915727673


Parameters (Session):
par1 = 8 ; par2 = 0 ;
Parameters (R input):
par1 = 8 ; par2 = 0 ;
R code (references can be found in the software module):
library(MASS)
par1 <- as.numeric(par1)
if (par2 == '0') par2 = 'Sturges' else par2 <- as.numeric(par2)
x <- as.ts(x) #otherwise the fitdistr function does not work properly
r <- fitdistr(x,'normal')
r
bitmap(file='test1.png')
myhist<-hist(x,col=par1,breaks=par2,main=main,ylab=ylab,xlab=xlab,freq=F)
curve(1/(r$estimate[2]*sqrt(2*pi))*exp(-1/2*((x-r$estimate[1])/r$estimate[2])^2),min(x),max(x),add=T)
dev.off()
load(file='createtable')
a<-table.start()
a<-table.row.start(a)
a<-table.element(a,'Parameter',1,TRUE)
a<-table.element(a,'Estimated Value',1,TRUE)
a<-table.element(a,'Standard Deviation',1,TRUE)
a<-table.row.end(a)
a<-table.row.start(a)
a<-table.element(a,'mean',header=TRUE)
a<-table.element(a,r$estimate[1])
a<-table.element(a,r$sd[1])
a<-table.row.end(a)
a<-table.row.start(a)
a<-table.element(a,'standard deviation',header=TRUE)
a<-table.element(a,r$estimate[2])
a<-table.element(a,r$sd[2])
a<-table.row.end(a)
a<-table.end(a)
table.save(a,file='mytable.tab')