Free Statistics

of Irreproducible Research!

Author's title

Author*The author of this computation has been verified*
R Software Modulerwasp_boxcoxlin.wasp
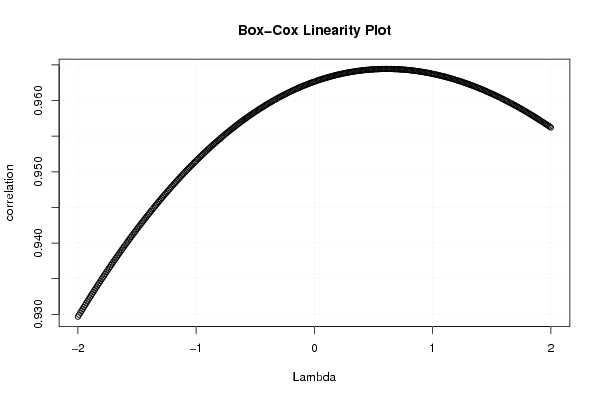
Title produced by softwareBox-Cox Linearity Plot
Date of computationTue, 11 Nov 2008 03:35:46 -0700
Cite this page as followsStatistical Computations at FreeStatistics.org, Office for Research Development and Education, URL https://freestatistics.org/blog/index.php?v=date/2008/Nov/11/t12263999993b0zuo9asktwytk.htm/, Retrieved Sun, 19 May 2024 10:44:37 +0000
Statistical Computations at FreeStatistics.org, Office for Research Development and Education, URL https://freestatistics.org/blog/index.php?pk=23293, Retrieved Sun, 19 May 2024 10:44:37 +0000
QR Codes:

Original text written by user:
IsPrivate?No (this computation is public)
User-defined keywords
Estimated Impact133
Family? (F = Feedback message, R = changed R code, M = changed R Module, P = changed Parameters, D = changed Data)
F       [Box-Cox Linearity Plot] [vraag 3] [2008-11-11 10:35:46] [3dc594a6c62226e1e98766c4d385bfaa] [Current]
Feedback Forum
2008-11-24 20:36:37 [Michaël De Kuyer] [reply
De Box-Cox transformatie is bedoeld om tijdreeksen te transformeren die problemen opleveren (geen lineair verband tonen). Het lambda getal transformeert de reeks zodat er een lineair verband = rechte ontstaat. Wanneer er door deze lambda rechte (Box-Cox Linearity Plot) geen max wordt bereikt kunnen er geen besluiten worden genomen. Een oplossing zou het vergroten van de lambda waarden zijn (dit kan door een aanpassing te doen in de R-code).

In dit geval bereikt lambda wel een maximum, maar de correlatie op zich was al zo groot dat het moeilijk is de correlatie nog te verbeteren.

Post a new message
Dataseries X:
2293
2045
1532
1333
1583
1712
2641
2267
2126
2231
1517
2010
2628
2115
1829
1636
1787
2122
2620
2555
2337
2524
1801
2417
2389
2266
2135
1755
1907
2178
2345
2674
2765
2786
2004
2589
2739
2700
2459
1965
2152
2379
2930
2691
2852
2752
1787
2580
2604
2532
2265
1745
1914
2148
2466
2498
2512
2458
1825
2267
2364
2328
2034
1587
1633
Dataseries Y:
440427
386715
291787
278253
300903
327695
471590
442850
387181
420099
289850
392468
549174
415506
356662
338612
359886
410547
495272
474588
442893
477793
336263
449838
451406
439690
401513
326472
369464
429525
464658
510691
513151
538609
398949
511635
554318
515879
488122
401716
453358
464884
571868
497485
538214
502396
349385
502427
514106
527537
495918
376847
420552
442679
478422
483796
529032
482991
354287
459146
473744
478642
426208
348908
321310


Summary of computational transaction
Raw Inputview raw input (R code)
Raw Outputview raw output of R engine
Computing time3 seconds
R Server'Herman Ole Andreas Wold' @ 193.190.124.10:1001

\begin{tabular}{lllllllll}
\hline
Summary of computational transaction \tabularnewline
Raw Input & view raw input (R code)  \tabularnewline
Raw Output & view raw output of R engine  \tabularnewline
Computing time & 3 seconds \tabularnewline
R Server & 'Herman Ole Andreas Wold' @ 193.190.124.10:1001 \tabularnewline
\hline
\end{tabular}
%Source: https://freestatistics.org/blog/index.php?pk=23293&T=0

[TABLE]
[ROW][C]Summary of computational transaction[/C][/ROW]
[ROW][C]Raw Input[/C][C]view raw input (R code) [/C][/ROW]
[ROW][C]Raw Output[/C][C]view raw output of R engine [/C][/ROW]
[ROW][C]Computing time[/C][C]3 seconds[/C][/ROW]
[ROW][C]R Server[/C][C]'Herman Ole Andreas Wold' @ 193.190.124.10:1001[/C][/ROW]
[/TABLE]
Source: https://freestatistics.org/blog/index.php?pk=23293&T=0

Globally Unique Identifier (entire table): ba.freestatistics.org/blog/index.php?pk=23293&T=0

As an alternative you can also use a QR Code:  

The GUIDs for individual cells are displayed in the table below:

Summary of computational transaction
Raw Inputview raw input (R code)
Raw Outputview raw output of R engine
Computing time3 seconds
R Server'Herman Ole Andreas Wold' @ 193.190.124.10:1001


Box-Cox Linearity Plot
# observations x65
maximum correlation0.964437412501667
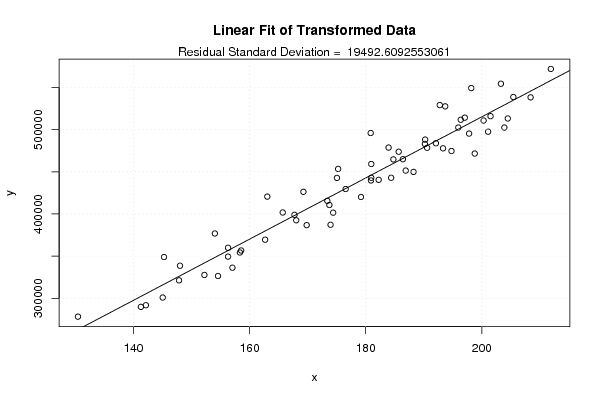
optimal lambda(x)0.61
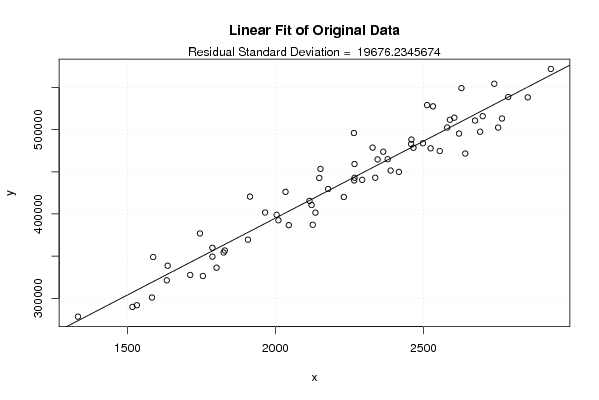
Residual SD (orginial)19676.2345674
Residual SD (transformed)19492.6092553061

\begin{tabular}{lllllllll}
\hline
Box-Cox Linearity Plot \tabularnewline
# observations x & 65 \tabularnewline
maximum correlation & 0.964437412501667 \tabularnewline
optimal lambda(x) & 0.61 \tabularnewline
Residual SD (orginial) & 19676.2345674 \tabularnewline
Residual SD (transformed) & 19492.6092553061 \tabularnewline
\hline
\end{tabular}
%Source: https://freestatistics.org/blog/index.php?pk=23293&T=1

[TABLE]
[ROW][C]Box-Cox Linearity Plot[/C][/ROW]
[ROW][C]# observations x[/C][C]65[/C][/ROW]
[ROW][C]maximum correlation[/C][C]0.964437412501667[/C][/ROW]
[ROW][C]optimal lambda(x)[/C][C]0.61[/C][/ROW]
[ROW][C]Residual SD (orginial)[/C][C]19676.2345674[/C][/ROW]
[ROW][C]Residual SD (transformed)[/C][C]19492.6092553061[/C][/ROW]
[/TABLE]
Source: https://freestatistics.org/blog/index.php?pk=23293&T=1

Globally Unique Identifier (entire table): ba.freestatistics.org/blog/index.php?pk=23293&T=1

As an alternative you can also use a QR Code:  

The GUIDs for individual cells are displayed in the table below:

Box-Cox Linearity Plot
# observations x65
maximum correlation0.964437412501667
optimal lambda(x)0.61
Residual SD (orginial)19676.2345674
Residual SD (transformed)19492.6092553061


Parameters (Session):
Parameters (R input):
R code (references can be found in the software module):
n <- length(x)
c <- array(NA,dim=c(401))
l <- array(NA,dim=c(401))
mx <- 0
mxli <- -999
for (i in 1:401)
{
l[i] <- (i-201)/100
if (l[i] != 0)
{
x1 <- (x^l[i] - 1) / l[i]
} else {
x1 <- log(x)
}
c[i] <- cor(x1,y)
if (mx < abs(c[i]))
{
mx <- abs(c[i])
mxli <- l[i]
}
}
c
mx
mxli
if (mxli != 0)
{
x1 <- (x^mxli - 1) / mxli
} else {
x1 <- log(x)
}
r<-lm(y~x)
se <- sqrt(var(r$residuals))
r1 <- lm(y~x1)
se1 <- sqrt(var(r1$residuals))
bitmap(file='test1.png')
plot(l,c,main='Box-Cox Linearity Plot',xlab='Lambda',ylab='correlation')
grid()
dev.off()
bitmap(file='test2.png')
plot(x,y,main='Linear Fit of Original Data',xlab='x',ylab='y')
abline(r)
grid()
mtext(paste('Residual Standard Deviation = ',se))
dev.off()
bitmap(file='test3.png')
plot(x1,y,main='Linear Fit of Transformed Data',xlab='x',ylab='y')
abline(r1)
grid()
mtext(paste('Residual Standard Deviation = ',se1))
dev.off()
load(file='createtable')
a<-table.start()
a<-table.row.start(a)
a<-table.element(a,'Box-Cox Linearity Plot',2,TRUE)
a<-table.row.end(a)
a<-table.row.start(a)
a<-table.element(a,'# observations x',header=TRUE)
a<-table.element(a,n)
a<-table.row.end(a)
a<-table.row.start(a)
a<-table.element(a,'maximum correlation',header=TRUE)
a<-table.element(a,mx)
a<-table.row.end(a)
a<-table.row.start(a)
a<-table.element(a,'optimal lambda(x)',header=TRUE)
a<-table.element(a,mxli)
a<-table.row.end(a)
a<-table.row.start(a)
a<-table.element(a,'Residual SD (orginial)',header=TRUE)
a<-table.element(a,se)
a<-table.row.end(a)
a<-table.row.start(a)
a<-table.element(a,'Residual SD (transformed)',header=TRUE)
a<-table.element(a,se1)
a<-table.row.end(a)
a<-table.end(a)
table.save(a,file='mytable.tab')