Free Statistics

of Irreproducible Research!

Author's title

Author*The author of this computation has been verified*
R Software Modulerwasp_hierarchicalclustering.wasp
Title produced by softwareHierarchical Clustering
Date of computationTue, 11 Nov 2008 03:34:09 -0700
Cite this page as followsStatistical Computations at FreeStatistics.org, Office for Research Development and Education, URL https://freestatistics.org/blog/index.php?v=date/2008/Nov/11/t1226399741wgain9i6oblx7a0.htm/, Retrieved Sun, 19 May 2024 12:36:25 +0000
Statistical Computations at FreeStatistics.org, Office for Research Development and Education, URL https://freestatistics.org/blog/index.php?pk=23288, Retrieved Sun, 19 May 2024 12:36:25 +0000
QR Codes:

Original text written by user:
IsPrivate?No (this computation is public)
User-defined keywords
Estimated Impact163
Family? (F = Feedback message, R = changed R code, M = changed R Module, P = changed Parameters, D = changed Data)
-     [Hierarchical Clustering] [Various EDA topic...] [2008-11-09 11:12:16] [b82ef11dce0545f3fd4676ec3ebed828]
-   P     [Hierarchical Clustering] [Various EDA topic...] [2008-11-11 10:34:09] [4b953869c7238aca4b6e0cfb0c5cddd6] [Current]
Feedback Forum

Post a new message
Dataseries X:
97.40	104.20	65.40	95.40
97.00	103.20	72.20	98.70
105.40	112.70	80.40	99.90
102.70	106.40	77.70	98.60
98.10	102.60	76.50	100.30
104.50	110.60	100.10	100.20
87.40	95.20	73.50	100.40
89.90	89.00	77.30	101.40
109.80	112.50	98.60	103.00
111.70	116.80	112.40	109.10
98.60	107.20	77.30	111.40
96.90	113.60	139.30	114.10
95.10	101.80	75.40	121.80
97.00	102.60	64.20	127.60
112.70	122.70	86.80	129.90
102.90	110.30	79.10	128.00
97.40	110.50	71.70	123.50
111.40	121.60	100.00	124.00
87.40	100.30	82.10	127.40
96.80	100.70	74.80	127.60
114.10	123.40	92.30	128.40
110.30	127.10	83.30	131.40
103.90	124.10	83.70	135.10
101.60	131.20	148.00	134.00
94.60	111.60	71.40	144.50
95.90	114.20	71.20	147.30
104.70	130.10	84.60	150.90
102.80	125.90	80.90	148.70
98.10	119.00	80.60	141.40
113.90	133.80	105.50	138.90
80.90	107.50	79.20	139.80
95.70	113.50	78.40	145.60
113.20	134.40	92.60	147.90
105.90	126.80	88.30	148.50
108.80	135.60	98.20	151.10
102.30	139.90	157.40	157.50
99.00	129.80	73.90	167.50
100.70	131.00	80.90	172.30
115.50	153.10	93.00	173.50
100.70	134.10	84.90	187.50
109.90	144.10	96.20	205.50
114.60	155.90	106.50	195.10
85.40	123.30	81.70	204.50
100.50	128.10	82.90	204.50
114.80	144.30	96.00	201.70
116.50	153.00	92.60	207.00
112.90	149.90	116.50	206.60
102.00	150.90	155.00	210.60
106.00	141.00	95.10	211.10
105.30	138.90	86.20	215.00
118.80	157.40	105.00	223.90
106.10	142.90	89.70	238.20
109.30	151.70	97.10	238.90
117.20	161.00	120.80	229.60
92.50	138.50	92.20	232.20
104.20	135.90	98.80	222.10
112.50	151.50	104.10	221.60
122.40	164.00	106.50	227.30
113.30	159.10	113.40	221.00
100.00	157.00	192.40	213.60
110.70	142.10	103.60	243.40
112.80	144.80	97.60	253.80
109.80	152.10	99.90	265.30
117.30	154.60	106.20	268.20
109.10	148.70	104.90	268.50
115.90	157.70	114.20	266.90
95.70	146.70	94.50	268.40


Summary of computational transaction
Raw Inputview raw input (R code)
Raw Outputview raw output of R engine
Computing time2 seconds
R Server'Sir Ronald Aylmer Fisher' @ 193.190.124.24

\begin{tabular}{lllllllll}
\hline
Summary of computational transaction \tabularnewline
Raw Input & view raw input (R code)  \tabularnewline
Raw Output & view raw output of R engine  \tabularnewline
Computing time & 2 seconds \tabularnewline
R Server & 'Sir Ronald Aylmer Fisher' @ 193.190.124.24 \tabularnewline
\hline
\end{tabular}
%Source: https://freestatistics.org/blog/index.php?pk=23288&T=0

[TABLE]
[ROW][C]Summary of computational transaction[/C][/ROW]
[ROW][C]Raw Input[/C][C]view raw input (R code) [/C][/ROW]
[ROW][C]Raw Output[/C][C]view raw output of R engine [/C][/ROW]
[ROW][C]Computing time[/C][C]2 seconds[/C][/ROW]
[ROW][C]R Server[/C][C]'Sir Ronald Aylmer Fisher' @ 193.190.124.24[/C][/ROW]
[/TABLE]
Source: https://freestatistics.org/blog/index.php?pk=23288&T=0

Globally Unique Identifier (entire table): ba.freestatistics.org/blog/index.php?pk=23288&T=0

As an alternative you can also use a QR Code:  

The GUIDs for individual cells are displayed in the table below:

Summary of computational transaction
Raw Inputview raw input (R code)
Raw Outputview raw output of R engine
Computing time2 seconds
R Server'Sir Ronald Aylmer Fisher' @ 193.190.124.24


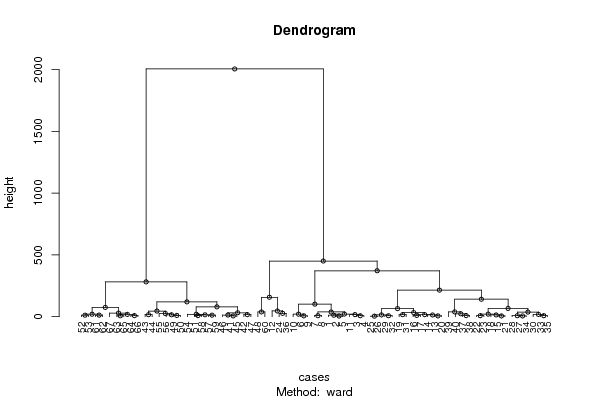
Summary of Dendrogram
LabelHeight
14.04103947023537
24.75604878023764
35.63737527578216
45.91185250154298
56.17251974480438
66.2072538211354
76.46451854355759
86.87677249878168
97.48064168370602
107.64787552199954
117.70956081228366
127.75435361587283
137.8993670632526
147.9881161734166
158.386298349093
168.73899307700836
178.7897667773383
189.96594200264079
1910.2615788258922
2011.6768205803551
2111.9553335377981
2212.0519707931940
2312.4843902534325
2413.0108159147509
2513.6430643785755
2614.0307284758347
2714.0760358538234
2815.0816505999458
2915.0882777902309
3015.8899339205674
3116.0081229380587
3216.3377918292690
3316.3830504573684
3416.466329281294
3518.0118434406908
3618.1742115724294
3719.4615792594989
3819.6257566684387
3920.3210357140386
4020.524412101805
4120.9252850609764
4223.2932375377684
4326.0434556677486
4426.7729340939689
4529.0472898862976
4631.4734240938864
4732.9319741717726
4837.0866753543346
4937.7393374631991
5038.0653385641058
5138.5555382588199
5245.4790219287071
5346.0724137488915
5465.3562398009453
5566.7129536912145
5674.8966415340184
5779.5452942893965
58101.206957604599
59119.639990653523
60141.100565887340
61156.987505043749
62214.744248106761
63281.502004609666
64371.61218083215
65450.278470396741
662005.19317692777

\begin{tabular}{lllllllll}
\hline
Summary of Dendrogram \tabularnewline
Label & Height \tabularnewline
1 & 4.04103947023537 \tabularnewline
2 & 4.75604878023764 \tabularnewline
3 & 5.63737527578216 \tabularnewline
4 & 5.91185250154298 \tabularnewline
5 & 6.17251974480438 \tabularnewline
6 & 6.2072538211354 \tabularnewline
7 & 6.46451854355759 \tabularnewline
8 & 6.87677249878168 \tabularnewline
9 & 7.48064168370602 \tabularnewline
10 & 7.64787552199954 \tabularnewline
11 & 7.70956081228366 \tabularnewline
12 & 7.75435361587283 \tabularnewline
13 & 7.8993670632526 \tabularnewline
14 & 7.9881161734166 \tabularnewline
15 & 8.386298349093 \tabularnewline
16 & 8.73899307700836 \tabularnewline
17 & 8.7897667773383 \tabularnewline
18 & 9.96594200264079 \tabularnewline
19 & 10.2615788258922 \tabularnewline
20 & 11.6768205803551 \tabularnewline
21 & 11.9553335377981 \tabularnewline
22 & 12.0519707931940 \tabularnewline
23 & 12.4843902534325 \tabularnewline
24 & 13.0108159147509 \tabularnewline
25 & 13.6430643785755 \tabularnewline
26 & 14.0307284758347 \tabularnewline
27 & 14.0760358538234 \tabularnewline
28 & 15.0816505999458 \tabularnewline
29 & 15.0882777902309 \tabularnewline
30 & 15.8899339205674 \tabularnewline
31 & 16.0081229380587 \tabularnewline
32 & 16.3377918292690 \tabularnewline
33 & 16.3830504573684 \tabularnewline
34 & 16.466329281294 \tabularnewline
35 & 18.0118434406908 \tabularnewline
36 & 18.1742115724294 \tabularnewline
37 & 19.4615792594989 \tabularnewline
38 & 19.6257566684387 \tabularnewline
39 & 20.3210357140386 \tabularnewline
40 & 20.524412101805 \tabularnewline
41 & 20.9252850609764 \tabularnewline
42 & 23.2932375377684 \tabularnewline
43 & 26.0434556677486 \tabularnewline
44 & 26.7729340939689 \tabularnewline
45 & 29.0472898862976 \tabularnewline
46 & 31.4734240938864 \tabularnewline
47 & 32.9319741717726 \tabularnewline
48 & 37.0866753543346 \tabularnewline
49 & 37.7393374631991 \tabularnewline
50 & 38.0653385641058 \tabularnewline
51 & 38.5555382588199 \tabularnewline
52 & 45.4790219287071 \tabularnewline
53 & 46.0724137488915 \tabularnewline
54 & 65.3562398009453 \tabularnewline
55 & 66.7129536912145 \tabularnewline
56 & 74.8966415340184 \tabularnewline
57 & 79.5452942893965 \tabularnewline
58 & 101.206957604599 \tabularnewline
59 & 119.639990653523 \tabularnewline
60 & 141.100565887340 \tabularnewline
61 & 156.987505043749 \tabularnewline
62 & 214.744248106761 \tabularnewline
63 & 281.502004609666 \tabularnewline
64 & 371.61218083215 \tabularnewline
65 & 450.278470396741 \tabularnewline
66 & 2005.19317692777 \tabularnewline
\hline
\end{tabular}
%Source: https://freestatistics.org/blog/index.php?pk=23288&T=1

[TABLE]
[ROW][C]Summary of Dendrogram[/C][/ROW]
[ROW][C]Label[/C][C]Height[/C][/ROW]
[ROW][C]1[/C][C]4.04103947023537[/C][/ROW]
[ROW][C]2[/C][C]4.75604878023764[/C][/ROW]
[ROW][C]3[/C][C]5.63737527578216[/C][/ROW]
[ROW][C]4[/C][C]5.91185250154298[/C][/ROW]
[ROW][C]5[/C][C]6.17251974480438[/C][/ROW]
[ROW][C]6[/C][C]6.2072538211354[/C][/ROW]
[ROW][C]7[/C][C]6.46451854355759[/C][/ROW]
[ROW][C]8[/C][C]6.87677249878168[/C][/ROW]
[ROW][C]9[/C][C]7.48064168370602[/C][/ROW]
[ROW][C]10[/C][C]7.64787552199954[/C][/ROW]
[ROW][C]11[/C][C]7.70956081228366[/C][/ROW]
[ROW][C]12[/C][C]7.75435361587283[/C][/ROW]
[ROW][C]13[/C][C]7.8993670632526[/C][/ROW]
[ROW][C]14[/C][C]7.9881161734166[/C][/ROW]
[ROW][C]15[/C][C]8.386298349093[/C][/ROW]
[ROW][C]16[/C][C]8.73899307700836[/C][/ROW]
[ROW][C]17[/C][C]8.7897667773383[/C][/ROW]
[ROW][C]18[/C][C]9.96594200264079[/C][/ROW]
[ROW][C]19[/C][C]10.2615788258922[/C][/ROW]
[ROW][C]20[/C][C]11.6768205803551[/C][/ROW]
[ROW][C]21[/C][C]11.9553335377981[/C][/ROW]
[ROW][C]22[/C][C]12.0519707931940[/C][/ROW]
[ROW][C]23[/C][C]12.4843902534325[/C][/ROW]
[ROW][C]24[/C][C]13.0108159147509[/C][/ROW]
[ROW][C]25[/C][C]13.6430643785755[/C][/ROW]
[ROW][C]26[/C][C]14.0307284758347[/C][/ROW]
[ROW][C]27[/C][C]14.0760358538234[/C][/ROW]
[ROW][C]28[/C][C]15.0816505999458[/C][/ROW]
[ROW][C]29[/C][C]15.0882777902309[/C][/ROW]
[ROW][C]30[/C][C]15.8899339205674[/C][/ROW]
[ROW][C]31[/C][C]16.0081229380587[/C][/ROW]
[ROW][C]32[/C][C]16.3377918292690[/C][/ROW]
[ROW][C]33[/C][C]16.3830504573684[/C][/ROW]
[ROW][C]34[/C][C]16.466329281294[/C][/ROW]
[ROW][C]35[/C][C]18.0118434406908[/C][/ROW]
[ROW][C]36[/C][C]18.1742115724294[/C][/ROW]
[ROW][C]37[/C][C]19.4615792594989[/C][/ROW]
[ROW][C]38[/C][C]19.6257566684387[/C][/ROW]
[ROW][C]39[/C][C]20.3210357140386[/C][/ROW]
[ROW][C]40[/C][C]20.524412101805[/C][/ROW]
[ROW][C]41[/C][C]20.9252850609764[/C][/ROW]
[ROW][C]42[/C][C]23.2932375377684[/C][/ROW]
[ROW][C]43[/C][C]26.0434556677486[/C][/ROW]
[ROW][C]44[/C][C]26.7729340939689[/C][/ROW]
[ROW][C]45[/C][C]29.0472898862976[/C][/ROW]
[ROW][C]46[/C][C]31.4734240938864[/C][/ROW]
[ROW][C]47[/C][C]32.9319741717726[/C][/ROW]
[ROW][C]48[/C][C]37.0866753543346[/C][/ROW]
[ROW][C]49[/C][C]37.7393374631991[/C][/ROW]
[ROW][C]50[/C][C]38.0653385641058[/C][/ROW]
[ROW][C]51[/C][C]38.5555382588199[/C][/ROW]
[ROW][C]52[/C][C]45.4790219287071[/C][/ROW]
[ROW][C]53[/C][C]46.0724137488915[/C][/ROW]
[ROW][C]54[/C][C]65.3562398009453[/C][/ROW]
[ROW][C]55[/C][C]66.7129536912145[/C][/ROW]
[ROW][C]56[/C][C]74.8966415340184[/C][/ROW]
[ROW][C]57[/C][C]79.5452942893965[/C][/ROW]
[ROW][C]58[/C][C]101.206957604599[/C][/ROW]
[ROW][C]59[/C][C]119.639990653523[/C][/ROW]
[ROW][C]60[/C][C]141.100565887340[/C][/ROW]
[ROW][C]61[/C][C]156.987505043749[/C][/ROW]
[ROW][C]62[/C][C]214.744248106761[/C][/ROW]
[ROW][C]63[/C][C]281.502004609666[/C][/ROW]
[ROW][C]64[/C][C]371.61218083215[/C][/ROW]
[ROW][C]65[/C][C]450.278470396741[/C][/ROW]
[ROW][C]66[/C][C]2005.19317692777[/C][/ROW]
[/TABLE]
Source: https://freestatistics.org/blog/index.php?pk=23288&T=1

Globally Unique Identifier (entire table): ba.freestatistics.org/blog/index.php?pk=23288&T=1

As an alternative you can also use a QR Code:  

The GUIDs for individual cells are displayed in the table below:

Summary of Dendrogram
LabelHeight
14.04103947023537
24.75604878023764
35.63737527578216
45.91185250154298
56.17251974480438
66.2072538211354
76.46451854355759
86.87677249878168
97.48064168370602
107.64787552199954
117.70956081228366
127.75435361587283
137.8993670632526
147.9881161734166
158.386298349093
168.73899307700836
178.7897667773383
189.96594200264079
1910.2615788258922
2011.6768205803551
2111.9553335377981
2212.0519707931940
2312.4843902534325
2413.0108159147509
2513.6430643785755
2614.0307284758347
2714.0760358538234
2815.0816505999458
2915.0882777902309
3015.8899339205674
3116.0081229380587
3216.3377918292690
3316.3830504573684
3416.466329281294
3518.0118434406908
3618.1742115724294
3719.4615792594989
3819.6257566684387
3920.3210357140386
4020.524412101805
4120.9252850609764
4223.2932375377684
4326.0434556677486
4426.7729340939689
4529.0472898862976
4631.4734240938864
4732.9319741717726
4837.0866753543346
4937.7393374631991
5038.0653385641058
5138.5555382588199
5245.4790219287071
5346.0724137488915
5465.3562398009453
5566.7129536912145
5674.8966415340184
5779.5452942893965
58101.206957604599
59119.639990653523
60141.100565887340
61156.987505043749
62214.744248106761
63281.502004609666
64371.61218083215
65450.278470396741
662005.19317692777


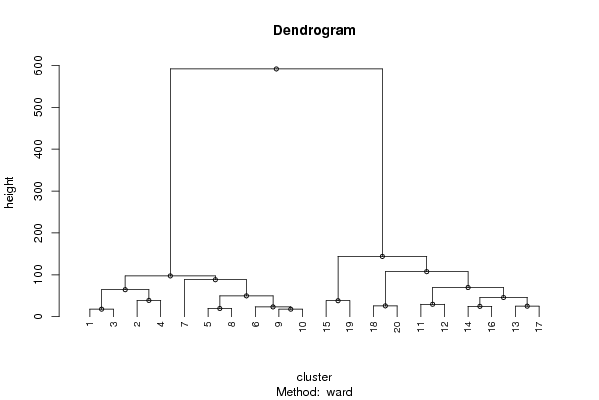
Summary of Cut Dendrogram
LabelHeight
117.8186543948875
217.9076333816988
319.4996526656664
423.2581638036847
524.6399827516173
625.0264979571653
725.7302599092974
829.5584167370311
938.0653385641058
1038.8059846472737
1145.7239913053094
1249.658933787771
1364.4494691441874
1469.5918252173467
1588.299793236445
1697.3446855432396
17107.564644651204
18143.855248826018
19591.814161293073

\begin{tabular}{lllllllll}
\hline
Summary of Cut Dendrogram \tabularnewline
Label & Height \tabularnewline
1 & 17.8186543948875 \tabularnewline
2 & 17.9076333816988 \tabularnewline
3 & 19.4996526656664 \tabularnewline
4 & 23.2581638036847 \tabularnewline
5 & 24.6399827516173 \tabularnewline
6 & 25.0264979571653 \tabularnewline
7 & 25.7302599092974 \tabularnewline
8 & 29.5584167370311 \tabularnewline
9 & 38.0653385641058 \tabularnewline
10 & 38.8059846472737 \tabularnewline
11 & 45.7239913053094 \tabularnewline
12 & 49.658933787771 \tabularnewline
13 & 64.4494691441874 \tabularnewline
14 & 69.5918252173467 \tabularnewline
15 & 88.299793236445 \tabularnewline
16 & 97.3446855432396 \tabularnewline
17 & 107.564644651204 \tabularnewline
18 & 143.855248826018 \tabularnewline
19 & 591.814161293073 \tabularnewline
\hline
\end{tabular}
%Source: https://freestatistics.org/blog/index.php?pk=23288&T=2

[TABLE]
[ROW][C]Summary of Cut Dendrogram[/C][/ROW]
[ROW][C]Label[/C][C]Height[/C][/ROW]
[ROW][C]1[/C][C]17.8186543948875[/C][/ROW]
[ROW][C]2[/C][C]17.9076333816988[/C][/ROW]
[ROW][C]3[/C][C]19.4996526656664[/C][/ROW]
[ROW][C]4[/C][C]23.2581638036847[/C][/ROW]
[ROW][C]5[/C][C]24.6399827516173[/C][/ROW]
[ROW][C]6[/C][C]25.0264979571653[/C][/ROW]
[ROW][C]7[/C][C]25.7302599092974[/C][/ROW]
[ROW][C]8[/C][C]29.5584167370311[/C][/ROW]
[ROW][C]9[/C][C]38.0653385641058[/C][/ROW]
[ROW][C]10[/C][C]38.8059846472737[/C][/ROW]
[ROW][C]11[/C][C]45.7239913053094[/C][/ROW]
[ROW][C]12[/C][C]49.658933787771[/C][/ROW]
[ROW][C]13[/C][C]64.4494691441874[/C][/ROW]
[ROW][C]14[/C][C]69.5918252173467[/C][/ROW]
[ROW][C]15[/C][C]88.299793236445[/C][/ROW]
[ROW][C]16[/C][C]97.3446855432396[/C][/ROW]
[ROW][C]17[/C][C]107.564644651204[/C][/ROW]
[ROW][C]18[/C][C]143.855248826018[/C][/ROW]
[ROW][C]19[/C][C]591.814161293073[/C][/ROW]
[/TABLE]
Source: https://freestatistics.org/blog/index.php?pk=23288&T=2

Globally Unique Identifier (entire table): ba.freestatistics.org/blog/index.php?pk=23288&T=2

As an alternative you can also use a QR Code:  

The GUIDs for individual cells are displayed in the table below:

Summary of Cut Dendrogram
LabelHeight
117.8186543948875
217.9076333816988
319.4996526656664
423.2581638036847
524.6399827516173
625.0264979571653
725.7302599092974
829.5584167370311
938.0653385641058
1038.8059846472737
1145.7239913053094
1249.658933787771
1364.4494691441874
1469.5918252173467
1588.299793236445
1697.3446855432396
17107.564644651204
18143.855248826018
19591.814161293073


Parameters (Session):
par1 = ward ; par2 = 20 ; par3 = FALSE ; par4 = FALSE ;
Parameters (R input):
par1 = ward ; par2 = 20 ; par3 = FALSE ; par4 = FALSE ;
R code (references can be found in the software module):
par3 <- as.logical(par3)
par4 <- as.logical(par4)
if (par3 == 'TRUE'){
dum = xlab
xlab = ylab
ylab = dum
}
x <- t(y)
hc <- hclust(dist(x),method=par1)
d <- as.dendrogram(hc)
str(d)
mysub <- paste('Method: ',par1)
bitmap(file='test1.png')
if (par4 == 'TRUE'){
plot(d,main=main,ylab=ylab,xlab=xlab,horiz=par3, nodePar=list(pch = c(1,NA), cex=0.8, lab.cex = 0.8),type='t',center=T, sub=mysub)
} else {
plot(d,main=main,ylab=ylab,xlab=xlab,horiz=par3, nodePar=list(pch = c(1,NA), cex=0.8, lab.cex = 0.8), sub=mysub)
}
dev.off()
if (par2 != 'ALL'){
if (par3 == 'TRUE'){
ylab = 'cluster'
} else {
xlab = 'cluster'
}
par2 <- as.numeric(par2)
memb <- cutree(hc, k = par2)
cent <- NULL
for(k in 1:par2){
cent <- rbind(cent, colMeans(x[memb == k, , drop = FALSE]))
}
hc1 <- hclust(dist(cent),method=par1, members = table(memb))
de <- as.dendrogram(hc1)
bitmap(file='test2.png')
if (par4 == 'TRUE'){
plot(de,main=main,ylab=ylab,xlab=xlab,horiz=par3, nodePar=list(pch = c(1,NA), cex=0.8, lab.cex = 0.8),type='t',center=T, sub=mysub)
} else {
plot(de,main=main,ylab=ylab,xlab=xlab,horiz=par3, nodePar=list(pch = c(1,NA), cex=0.8, lab.cex = 0.8), sub=mysub)
}
dev.off()
str(de)
}
load(file='createtable')
a<-table.start()
a<-table.row.start(a)
a<-table.element(a,'Summary of Dendrogram',2,TRUE)
a<-table.row.end(a)
a<-table.row.start(a)
a<-table.element(a,'Label',header=TRUE)
a<-table.element(a,'Height',header=TRUE)
a<-table.row.end(a)
num <- length(x[,1])-1
for (i in 1:num)
{
a<-table.row.start(a)
a<-table.element(a,hc$labels[i])
a<-table.element(a,hc$height[i])
a<-table.row.end(a)
}
a<-table.end(a)
table.save(a,file='mytable1.tab')
if (par2 != 'ALL'){
a<-table.start()
a<-table.row.start(a)
a<-table.element(a,'Summary of Cut Dendrogram',2,TRUE)
a<-table.row.end(a)
a<-table.row.start(a)
a<-table.element(a,'Label',header=TRUE)
a<-table.element(a,'Height',header=TRUE)
a<-table.row.end(a)
num <- par2-1
for (i in 1:num)
{
a<-table.row.start(a)
a<-table.element(a,i)
a<-table.element(a,hc1$height[i])
a<-table.row.end(a)
}
a<-table.end(a)
table.save(a,file='mytable2.tab')
}