Free Statistics

of Irreproducible Research!

Author's title

Author*The author of this computation has been verified*
R Software Modulerwasp_boxcoxnorm.wasp
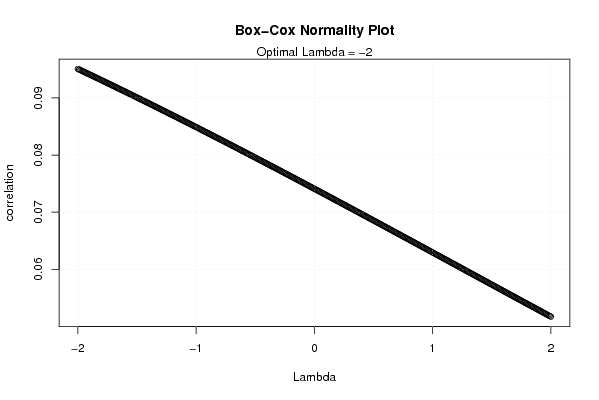
Title produced by softwareBox-Cox Normality Plot
Date of computationMon, 10 Nov 2008 15:32:57 -0700
Cite this page as followsStatistical Computations at FreeStatistics.org, Office for Research Development and Education, URL https://freestatistics.org/blog/index.php?v=date/2008/Nov/10/t1226356428b8ke33gbt35zdgf.htm/, Retrieved Sun, 19 May 2024 12:19:52 +0000
Statistical Computations at FreeStatistics.org, Office for Research Development and Education, URL https://freestatistics.org/blog/index.php?pk=23218, Retrieved Sun, 19 May 2024 12:19:52 +0000
QR Codes:

Original text written by user:
IsPrivate?No (this computation is public)
User-defined keywords
Estimated Impact180
Family? (F = Feedback message, R = changed R code, M = changed R Module, P = changed Parameters, D = changed Data)
F     [Partial Correlation] [Partial correlation] [2008-11-08 12:17:14] [82d201ca7b4e7cd2c6f885d29b5b6937]
F RM D  [Box-Cox Normality Plot] [Box Cox Normality] [2008-11-09 12:35:32] [82d201ca7b4e7cd2c6f885d29b5b6937]
F           [Box-Cox Normality Plot] [Box cox normality] [2008-11-10 22:32:57] [d6e9f26c3644bfc30f06303d9993b878] [Current]
Feedback Forum
2008-11-14 10:38:41 [Ciska Tanghe] [reply
Wat is het verschil met de Box-Cox linearity plot als je deze grafiek bestudeert?
2008-11-20 09:57:54 [An De Koninck] [reply
Je ziet duidelijk dat deze grafiek helemaal anders loopt dan de grafiek in de vorige vraag.
In de vorige vraag (Q3) liep de grafiek immers opwaarts van L naar R en in vraag Q4 loopt deze neerwaarts van L naar R.
2008-11-21 19:03:41 [Michael Van Spaandonck] [reply
Het maximum is wederom niet in de grafiek vervat, dus mag er geen conclusie worden getrokken.
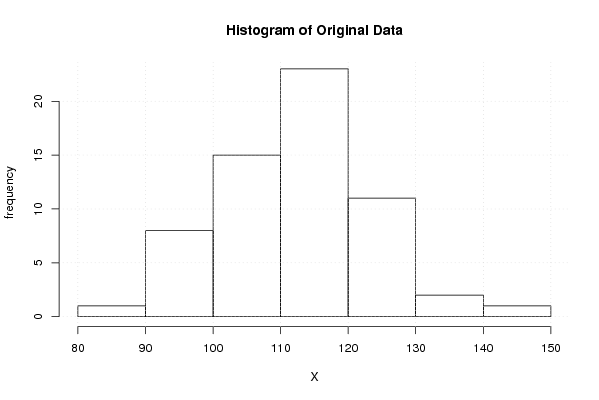
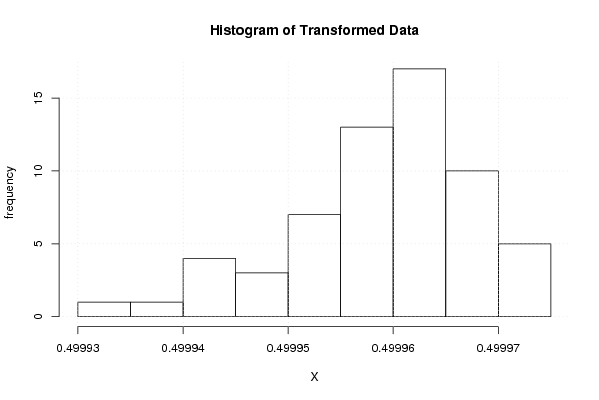
Bovendien geven de histogrammen aan dat een transformatie de normaalverdeling die bij de orignele data heerst verstoort.
2008-11-23 21:58:18 [Isabel Wilms] [reply
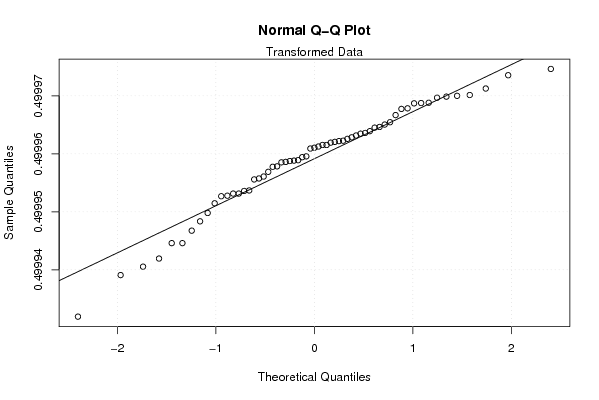
box-cox normality plot: hier transformeren we ook de tijdreeks. Omdat we eerst geen normaalverdeling hadden en voor sommige tests een normaalverdeling aangewezen is, proberen we de r-code te veranderen zodat we een normaalverdeling krijgen. Hier veranderen we dus niet de x (zoals bij box-cox lineairity plot) maar wel de y gaan we bewerken. Dit wordt dan, ((y tot de macht lambda)-1)/ lambda. Hier zoeken we dan ook het max uit de grafiek, dus de lambdawaarde met de hoogste correlatie. (wanneer deze niet in de grafiek ligt, moet je de grafieklimieten aanpassen). Deze waarde gebruiken we dan om de tijdreeks normaal te maken. we zien hier in dit stukje grafiek een max, maar dit is een stijgende rechte, dus we weten niet zeker of dit echt het max is. We kunnen geen besluit nemen.
2008-11-24 15:59:45 [Bernard Femont] [reply
Er is duidelijk een verschil met deze en de vorige grafiek (vraag) het verloop is namelijk veranderd. Wel is het misleidend om een conclusie te trekken mits het maximum niet in de grafiek geintegreerd is. (foute waarnemingen)
We proberen de r-code te veranderen zodat we een normaalverdeling krijgen. Omdat de tijdsreeks getransformeerd wordt. We hebben normaalverdeling nodig om aan de eisen van de test tegemoet te komen. Hier veranderen we dus niet de x (zoals bij box-cox lineairity plot) maar wel de y gaan we bewerken. Dit wordt dan, ((y tot de macht lambda)-1)/ lambda. Hier zoeken we dan ook het max uit de grafiek, dus de lambdawaarde met de hoogste correlatie. (wanneer deze niet in de grafiek ligt, moet je de grafieklimieten aanpassen). Deze waarde gebruiken we dan om de tijdreeks normaal te maken. we zien hier in dit stukje grafiek een max, maar dit is een stijgende rechte, hoe nagaan of dit een maximum is, besluit trekken is nog niet mogelijk.

Post a new message
Dataseries X:
118,9
108,8
115,6
95,0
92,8
108,9
109,8
106,1
102,8
98,4
85,7
114,6
129,4
117,7
126,6
103,8
101,5
118,7
119,6
114,8
109,9
106,3
95,0
124,5
140,4
128,8
137,5
113,3
110,3
129,1
128,4
120,3
113,6
96,9
124,7
126,4
131,9
122,5
113,1
99,8
116,0
115,0
114,0
111,0
91,7
90,6
103,3
106,7
111,2
102,9
126,5
115,1
110,2
110,1
103,3
107,7
103,9
114,0
117,2
117,0
116,5


Summary of computational transaction
Raw Inputview raw input (R code)
Raw Outputview raw output of R engine
Computing time2 seconds
R Server'George Udny Yule' @ 72.249.76.132

\begin{tabular}{lllllllll}
\hline
Summary of computational transaction \tabularnewline
Raw Input & view raw input (R code)  \tabularnewline
Raw Output & view raw output of R engine  \tabularnewline
Computing time & 2 seconds \tabularnewline
R Server & 'George Udny Yule' @ 72.249.76.132 \tabularnewline
\hline
\end{tabular}
%Source: https://freestatistics.org/blog/index.php?pk=23218&T=0

[TABLE]
[ROW][C]Summary of computational transaction[/C][/ROW]
[ROW][C]Raw Input[/C][C]view raw input (R code) [/C][/ROW]
[ROW][C]Raw Output[/C][C]view raw output of R engine [/C][/ROW]
[ROW][C]Computing time[/C][C]2 seconds[/C][/ROW]
[ROW][C]R Server[/C][C]'George Udny Yule' @ 72.249.76.132[/C][/ROW]
[/TABLE]
Source: https://freestatistics.org/blog/index.php?pk=23218&T=0

Globally Unique Identifier (entire table): ba.freestatistics.org/blog/index.php?pk=23218&T=0

As an alternative you can also use a QR Code:  

The GUIDs for individual cells are displayed in the table below:

Summary of computational transaction
Raw Inputview raw input (R code)
Raw Outputview raw output of R engine
Computing time2 seconds
R Server'George Udny Yule' @ 72.249.76.132


Box-Cox Normality Plot
# observations x61
maximum correlation0.0950513663079315
optimal lambda-2

\begin{tabular}{lllllllll}
\hline
Box-Cox Normality Plot \tabularnewline
# observations x & 61 \tabularnewline
maximum correlation & 0.0950513663079315 \tabularnewline
optimal lambda & -2 \tabularnewline
\hline
\end{tabular}
%Source: https://freestatistics.org/blog/index.php?pk=23218&T=1

[TABLE]
[ROW][C]Box-Cox Normality Plot[/C][/ROW]
[ROW][C]# observations x[/C][C]61[/C][/ROW]
[ROW][C]maximum correlation[/C][C]0.0950513663079315[/C][/ROW]
[ROW][C]optimal lambda[/C][C]-2[/C][/ROW]
[/TABLE]
Source: https://freestatistics.org/blog/index.php?pk=23218&T=1

Globally Unique Identifier (entire table): ba.freestatistics.org/blog/index.php?pk=23218&T=1

As an alternative you can also use a QR Code:  

The GUIDs for individual cells are displayed in the table below:

Box-Cox Normality Plot
# observations x61
maximum correlation0.0950513663079315
optimal lambda-2


Parameters (Session):
Parameters (R input):
par1 = ; par2 = ; par3 = ; par4 = ; par5 = ; par6 = ; par7 = ; par8 = ; par9 = ; par10 = ; par11 = ; par12 = ; par13 = ; par14 = ; par15 = ; par16 = ; par17 = ; par18 = ; par19 = ; par20 = ;
R code (references can be found in the software module):
n <- length(x)
c <- array(NA,dim=c(401))
l <- array(NA,dim=c(401))
mx <- 0
mxli <- -999
for (i in 1:401)
{
l[i] <- (i-201)/100
if (l[i] != 0)
{
x1 <- (x^l[i] - 1) / l[i]
} else {
x1 <- log(x)
}
c[i] <- cor(qnorm(ppoints(x), mean=0, sd=1),x1)
if (mx < c[i])
{
mx <- c[i]
mxli <- l[i]
}
}
c
mx
mxli
if (mxli != 0)
{
x1 <- (x^mxli - 1) / mxli
} else {
x1 <- log(x)
}
bitmap(file='test1.png')
plot(l,c,main='Box-Cox Normality Plot',xlab='Lambda',ylab='correlation')
mtext(paste('Optimal Lambda =',mxli))
grid()
dev.off()
bitmap(file='test2.png')
hist(x,main='Histogram of Original Data',xlab='X',ylab='frequency')
grid()
dev.off()
bitmap(file='test3.png')
hist(x1,main='Histogram of Transformed Data',xlab='X',ylab='frequency')
grid()
dev.off()
bitmap(file='test4.png')
qqnorm(x)
qqline(x)
grid()
mtext('Original Data')
dev.off()
bitmap(file='test5.png')
qqnorm(x1)
qqline(x1)
grid()
mtext('Transformed Data')
dev.off()
load(file='createtable')
a<-table.start()
a<-table.row.start(a)
a<-table.element(a,'Box-Cox Normality Plot',2,TRUE)
a<-table.row.end(a)
a<-table.row.start(a)
a<-table.element(a,'# observations x',header=TRUE)
a<-table.element(a,n)
a<-table.row.end(a)
a<-table.row.start(a)
a<-table.element(a,'maximum correlation',header=TRUE)
a<-table.element(a,mx)
a<-table.row.end(a)
a<-table.row.start(a)
a<-table.element(a,'optimal lambda',header=TRUE)
a<-table.element(a,mxli)
a<-table.row.end(a)
a<-table.end(a)
table.save(a,file='mytable.tab')