Free Statistics

of Irreproducible Research!

Author's title

Author*The author of this computation has been verified*
R Software Modulerwasp_hierarchicalclustering.wasp
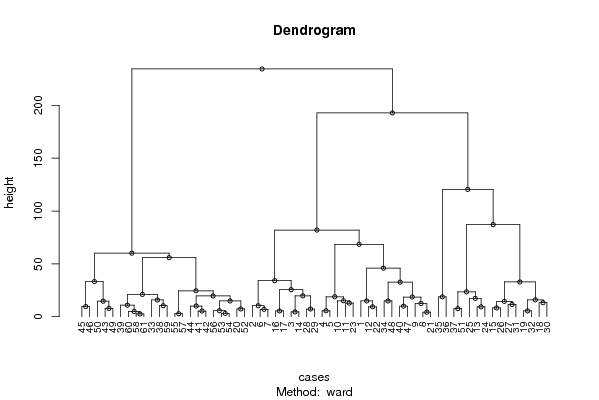
Title produced by softwareHierarchical Clustering
Date of computationMon, 10 Nov 2008 15:13:06 -0700
Cite this page as followsStatistical Computations at FreeStatistics.org, Office for Research Development and Education, URL https://freestatistics.org/blog/index.php?v=date/2008/Nov/10/t1226355279nvefoikxyxcgczz.htm/, Retrieved Sun, 19 May 2024 10:20:22 +0000
Statistical Computations at FreeStatistics.org, Office for Research Development and Education, URL https://freestatistics.org/blog/index.php?pk=23215, Retrieved Sun, 19 May 2024 10:20:22 +0000
QR Codes:

Original text written by user:
IsPrivate?No (this computation is public)
User-defined keywords
Estimated Impact189
Family? (F = Feedback message, R = changed R code, M = changed R Module, P = changed Parameters, D = changed Data)
F     [Partial Correlation] [Partial correlation] [2008-11-08 12:17:14] [82d201ca7b4e7cd2c6f885d29b5b6937]
F RMPD  [Hierarchical Clustering] [Compete] [2008-11-09 12:18:16] [82d201ca7b4e7cd2c6f885d29b5b6937]
F    D    [Hierarchical Clustering] [Complete clustering] [2008-11-10 22:10:28] [8d78428855b119373cac369316c08983]
F   P         [Hierarchical Clustering] [Ward] [2008-11-10 22:13:06] [d6e9f26c3644bfc30f06303d9993b878] [Current]
Feedback Forum
2008-11-14 10:37:27 [Ciska Tanghe] [reply
Hoe interpreteer je deze grafiek?
2008-11-21 18:41:57 [Michael Van Spaandonck] [reply
Het verschil in techniek tussen complete clustering en Ward clustering is mij niet bekend. Wel zie je dat er bij Ward clustering waarschijnlijk een ander criterium gebruikt wordt aangezien ditmaal de linkertak dichter bevolkt is dan bij complete clustering het geval was.
(http://www.freestatistics.org/blog/index.php?v=date/2008/Nov/10/t1226355114r1q0o71yy94x9pq.htm/)

Post a new message
Dataseries X:
116.1	117.1	118.9	100.3
102.5	107.0	108.8	97.6
102.0	107.0	115.6	89.1
101.3	111.0	95.0	99.1
100.6	108.2	92.8	94.9
100.9	96.3	108.9	96.5
104.2	100.9	109.8	92.6
108.3	107.7	106.1	80.8
108.9	106.2	102.8	89.5
109.9	118.7	98.4	101.4
106.8	116.1	85.7	95.9
112.7	118.1	114.6	92.3
113.4	118.4	129.4	91.2
101.3	110.8	117.7	88.3
97.8	106.4	126.6	80.7
95.0	112.2	103.8	89.9
93.8	108.3	101.5	87.2
94.5	96.0	118.7	86.9
101.4	100.6	119.6	82.8
105.8	107.8	114.8	72.6
106.6	108.4	109.9	81.3
109.7	120.9	106.3	91.2
108.8	117.3	95.0	87.3
113.4	119.7	124.5	83.4
113.7	119.6	140.4	81.7
103.6	111.8	128.8	80.2
98.2	108.1	137.5	74.1
95.5	111.8	113.3	80.6
94.4	105.5	110.3	79.0
95.9	93.6	129.1	79.3
103.2	103.9	128.4	71.2
104.1	100.3	120.3	78.1
127.6	106.6	113.6	68.2
130.3	118.4	96.9	81.0
133.0	106.6	124.7	106.9
140.4	109.8	126.4	123.7
123.5	115.9	131.9	73.7
116.9	111.7	122.5	69.2
115.9	119.8	113.1	72.5
113.1	116.1	99.8	75.7
112.1	103.2	116.0	73.5
112.4	99.0	115.0	70.4
118.9	112.3	114.0	65.7
117.4	104.2	111.0	68.1
115.6	114.0	91.7	62.4
120.7	121.7	90.6	64.7
114.9	107.2	103.3	77.7
122.0	112.8	106.7	85.9
119.6	117.8	111.2	61.0
114.6	113.3	102.9	57.4
118.4	116.1	126.5	75.1
110.9	111.8	115.1	75.9
111.6	110.2	110.2	71.8
114.6	110.0	110.1	72.3
112.1	102.9	103.3	67.3
117.4	110.1	107.7	71.5
114.8	102.7	103.9	67.6
123.4	118.7	114.0	74.2
118.1	109.0	117.2	77.6
121.9	115.7	117.0	76.4
123.3	118.1	116.5	74.2


Summary of computational transaction
Raw Inputview raw input (R code)
Raw Outputview raw output of R engine
Computing time2 seconds
R Server'Sir Ronald Aylmer Fisher' @ 193.190.124.24

\begin{tabular}{lllllllll}
\hline
Summary of computational transaction \tabularnewline
Raw Input & view raw input (R code)  \tabularnewline
Raw Output & view raw output of R engine  \tabularnewline
Computing time & 2 seconds \tabularnewline
R Server & 'Sir Ronald Aylmer Fisher' @ 193.190.124.24 \tabularnewline
\hline
\end{tabular}
%Source: https://freestatistics.org/blog/index.php?pk=23215&T=0

[TABLE]
[ROW][C]Summary of computational transaction[/C][/ROW]
[ROW][C]Raw Input[/C][C]view raw input (R code) [/C][/ROW]
[ROW][C]Raw Output[/C][C]view raw output of R engine [/C][/ROW]
[ROW][C]Computing time[/C][C]2 seconds[/C][/ROW]
[ROW][C]R Server[/C][C]'Sir Ronald Aylmer Fisher' @ 193.190.124.24[/C][/ROW]
[/TABLE]
Source: https://freestatistics.org/blog/index.php?pk=23215&T=0

Globally Unique Identifier (entire table): ba.freestatistics.org/blog/index.php?pk=23215&T=0

As an alternative you can also use a QR Code:  

The GUIDs for individual cells are displayed in the table below:

Summary of computational transaction
Raw Inputview raw input (R code)
Raw Outputview raw output of R engine
Computing time2 seconds
R Server'Sir Ronald Aylmer Fisher' @ 193.190.124.24


Summary of Dendrogram
LabelHeight
12.57293606605372
22.78926513619628
33.04959013639538
44.25088226136647
54.4698993277254
64.86775327677004
75.32353266168247
85.40647759636531
95.4735728733616
105.55067563455116
115.7159245672951
126.93325320466519
137.24292758489272
147.27942305406137
157.56108457828637
167.78909494100566
178.2395388220458
189.30268778364619
199.32416216075203
209.5812316536028
219.93478736561583
2210.0171141489568
2310.3591767966024
2410.3624321469431
2510.8571804347509
2611.5697882435246
2712.4150574746360
2812.879829191414
2913.1772531280233
3014.4371929400574
3114.6169664103140
3214.842506526864
3314.8596296399774
3414.8800636015085
3515.0614519225805
3615.8150102722386
3715.8767541026108
3817.2862569222107
3918.6021757532703
4018.7117610074520
4118.8211773030117
4219.6522587762426
4319.6996810664725
4421.0644331488876
4523.5230664559955
4624.5074017537682
4725.5054557866368
4832.6812032778592
4932.8222936704997
5033.2005696220011
5134.1171034295239
5245.8841099503659
5355.8717550857903
5460.1145801076398
5568.4854796553501
5682.0120989166368
5787.1936733323854
58120.462352740996
59192.891353888930
60234.539300309508

\begin{tabular}{lllllllll}
\hline
Summary of Dendrogram \tabularnewline
Label & Height \tabularnewline
1 & 2.57293606605372 \tabularnewline
2 & 2.78926513619628 \tabularnewline
3 & 3.04959013639538 \tabularnewline
4 & 4.25088226136647 \tabularnewline
5 & 4.4698993277254 \tabularnewline
6 & 4.86775327677004 \tabularnewline
7 & 5.32353266168247 \tabularnewline
8 & 5.40647759636531 \tabularnewline
9 & 5.4735728733616 \tabularnewline
10 & 5.55067563455116 \tabularnewline
11 & 5.7159245672951 \tabularnewline
12 & 6.93325320466519 \tabularnewline
13 & 7.24292758489272 \tabularnewline
14 & 7.27942305406137 \tabularnewline
15 & 7.56108457828637 \tabularnewline
16 & 7.78909494100566 \tabularnewline
17 & 8.2395388220458 \tabularnewline
18 & 9.30268778364619 \tabularnewline
19 & 9.32416216075203 \tabularnewline
20 & 9.5812316536028 \tabularnewline
21 & 9.93478736561583 \tabularnewline
22 & 10.0171141489568 \tabularnewline
23 & 10.3591767966024 \tabularnewline
24 & 10.3624321469431 \tabularnewline
25 & 10.8571804347509 \tabularnewline
26 & 11.5697882435246 \tabularnewline
27 & 12.4150574746360 \tabularnewline
28 & 12.879829191414 \tabularnewline
29 & 13.1772531280233 \tabularnewline
30 & 14.4371929400574 \tabularnewline
31 & 14.6169664103140 \tabularnewline
32 & 14.842506526864 \tabularnewline
33 & 14.8596296399774 \tabularnewline
34 & 14.8800636015085 \tabularnewline
35 & 15.0614519225805 \tabularnewline
36 & 15.8150102722386 \tabularnewline
37 & 15.8767541026108 \tabularnewline
38 & 17.2862569222107 \tabularnewline
39 & 18.6021757532703 \tabularnewline
40 & 18.7117610074520 \tabularnewline
41 & 18.8211773030117 \tabularnewline
42 & 19.6522587762426 \tabularnewline
43 & 19.6996810664725 \tabularnewline
44 & 21.0644331488876 \tabularnewline
45 & 23.5230664559955 \tabularnewline
46 & 24.5074017537682 \tabularnewline
47 & 25.5054557866368 \tabularnewline
48 & 32.6812032778592 \tabularnewline
49 & 32.8222936704997 \tabularnewline
50 & 33.2005696220011 \tabularnewline
51 & 34.1171034295239 \tabularnewline
52 & 45.8841099503659 \tabularnewline
53 & 55.8717550857903 \tabularnewline
54 & 60.1145801076398 \tabularnewline
55 & 68.4854796553501 \tabularnewline
56 & 82.0120989166368 \tabularnewline
57 & 87.1936733323854 \tabularnewline
58 & 120.462352740996 \tabularnewline
59 & 192.891353888930 \tabularnewline
60 & 234.539300309508 \tabularnewline
\hline
\end{tabular}
%Source: https://freestatistics.org/blog/index.php?pk=23215&T=1

[TABLE]
[ROW][C]Summary of Dendrogram[/C][/ROW]
[ROW][C]Label[/C][C]Height[/C][/ROW]
[ROW][C]1[/C][C]2.57293606605372[/C][/ROW]
[ROW][C]2[/C][C]2.78926513619628[/C][/ROW]
[ROW][C]3[/C][C]3.04959013639538[/C][/ROW]
[ROW][C]4[/C][C]4.25088226136647[/C][/ROW]
[ROW][C]5[/C][C]4.4698993277254[/C][/ROW]
[ROW][C]6[/C][C]4.86775327677004[/C][/ROW]
[ROW][C]7[/C][C]5.32353266168247[/C][/ROW]
[ROW][C]8[/C][C]5.40647759636531[/C][/ROW]
[ROW][C]9[/C][C]5.4735728733616[/C][/ROW]
[ROW][C]10[/C][C]5.55067563455116[/C][/ROW]
[ROW][C]11[/C][C]5.7159245672951[/C][/ROW]
[ROW][C]12[/C][C]6.93325320466519[/C][/ROW]
[ROW][C]13[/C][C]7.24292758489272[/C][/ROW]
[ROW][C]14[/C][C]7.27942305406137[/C][/ROW]
[ROW][C]15[/C][C]7.56108457828637[/C][/ROW]
[ROW][C]16[/C][C]7.78909494100566[/C][/ROW]
[ROW][C]17[/C][C]8.2395388220458[/C][/ROW]
[ROW][C]18[/C][C]9.30268778364619[/C][/ROW]
[ROW][C]19[/C][C]9.32416216075203[/C][/ROW]
[ROW][C]20[/C][C]9.5812316536028[/C][/ROW]
[ROW][C]21[/C][C]9.93478736561583[/C][/ROW]
[ROW][C]22[/C][C]10.0171141489568[/C][/ROW]
[ROW][C]23[/C][C]10.3591767966024[/C][/ROW]
[ROW][C]24[/C][C]10.3624321469431[/C][/ROW]
[ROW][C]25[/C][C]10.8571804347509[/C][/ROW]
[ROW][C]26[/C][C]11.5697882435246[/C][/ROW]
[ROW][C]27[/C][C]12.4150574746360[/C][/ROW]
[ROW][C]28[/C][C]12.879829191414[/C][/ROW]
[ROW][C]29[/C][C]13.1772531280233[/C][/ROW]
[ROW][C]30[/C][C]14.4371929400574[/C][/ROW]
[ROW][C]31[/C][C]14.6169664103140[/C][/ROW]
[ROW][C]32[/C][C]14.842506526864[/C][/ROW]
[ROW][C]33[/C][C]14.8596296399774[/C][/ROW]
[ROW][C]34[/C][C]14.8800636015085[/C][/ROW]
[ROW][C]35[/C][C]15.0614519225805[/C][/ROW]
[ROW][C]36[/C][C]15.8150102722386[/C][/ROW]
[ROW][C]37[/C][C]15.8767541026108[/C][/ROW]
[ROW][C]38[/C][C]17.2862569222107[/C][/ROW]
[ROW][C]39[/C][C]18.6021757532703[/C][/ROW]
[ROW][C]40[/C][C]18.7117610074520[/C][/ROW]
[ROW][C]41[/C][C]18.8211773030117[/C][/ROW]
[ROW][C]42[/C][C]19.6522587762426[/C][/ROW]
[ROW][C]43[/C][C]19.6996810664725[/C][/ROW]
[ROW][C]44[/C][C]21.0644331488876[/C][/ROW]
[ROW][C]45[/C][C]23.5230664559955[/C][/ROW]
[ROW][C]46[/C][C]24.5074017537682[/C][/ROW]
[ROW][C]47[/C][C]25.5054557866368[/C][/ROW]
[ROW][C]48[/C][C]32.6812032778592[/C][/ROW]
[ROW][C]49[/C][C]32.8222936704997[/C][/ROW]
[ROW][C]50[/C][C]33.2005696220011[/C][/ROW]
[ROW][C]51[/C][C]34.1171034295239[/C][/ROW]
[ROW][C]52[/C][C]45.8841099503659[/C][/ROW]
[ROW][C]53[/C][C]55.8717550857903[/C][/ROW]
[ROW][C]54[/C][C]60.1145801076398[/C][/ROW]
[ROW][C]55[/C][C]68.4854796553501[/C][/ROW]
[ROW][C]56[/C][C]82.0120989166368[/C][/ROW]
[ROW][C]57[/C][C]87.1936733323854[/C][/ROW]
[ROW][C]58[/C][C]120.462352740996[/C][/ROW]
[ROW][C]59[/C][C]192.891353888930[/C][/ROW]
[ROW][C]60[/C][C]234.539300309508[/C][/ROW]
[/TABLE]
Source: https://freestatistics.org/blog/index.php?pk=23215&T=1

Globally Unique Identifier (entire table): ba.freestatistics.org/blog/index.php?pk=23215&T=1

As an alternative you can also use a QR Code:  

The GUIDs for individual cells are displayed in the table below:

Summary of Dendrogram
LabelHeight
12.57293606605372
22.78926513619628
33.04959013639538
44.25088226136647
54.4698993277254
64.86775327677004
75.32353266168247
85.40647759636531
95.4735728733616
105.55067563455116
115.7159245672951
126.93325320466519
137.24292758489272
147.27942305406137
157.56108457828637
167.78909494100566
178.2395388220458
189.30268778364619
199.32416216075203
209.5812316536028
219.93478736561583
2210.0171141489568
2310.3591767966024
2410.3624321469431
2510.8571804347509
2611.5697882435246
2712.4150574746360
2812.879829191414
2913.1772531280233
3014.4371929400574
3114.6169664103140
3214.842506526864
3314.8596296399774
3414.8800636015085
3515.0614519225805
3615.8150102722386
3715.8767541026108
3817.2862569222107
3918.6021757532703
4018.7117610074520
4118.8211773030117
4219.6522587762426
4319.6996810664725
4421.0644331488876
4523.5230664559955
4624.5074017537682
4725.5054557866368
4832.6812032778592
4932.8222936704997
5033.2005696220011
5134.1171034295239
5245.8841099503659
5355.8717550857903
5460.1145801076398
5568.4854796553501
5682.0120989166368
5787.1936733323854
58120.462352740996
59192.891353888930
60234.539300309508


Parameters (Session):
par1 = ward ; par2 = ALL ; par3 = FALSE ; par4 = FALSE ;
Parameters (R input):
par1 = ward ; par2 = ALL ; par3 = FALSE ; par4 = FALSE ;
R code (references can be found in the software module):
par3 <- as.logical(par3)
par4 <- as.logical(par4)
if (par3 == 'TRUE'){
dum = xlab
xlab = ylab
ylab = dum
}
x <- t(y)
hc <- hclust(dist(x),method=par1)
d <- as.dendrogram(hc)
str(d)
mysub <- paste('Method: ',par1)
bitmap(file='test1.png')
if (par4 == 'TRUE'){
plot(d,main=main,ylab=ylab,xlab=xlab,horiz=par3, nodePar=list(pch = c(1,NA), cex=0.8, lab.cex = 0.8),type='t',center=T, sub=mysub)
} else {
plot(d,main=main,ylab=ylab,xlab=xlab,horiz=par3, nodePar=list(pch = c(1,NA), cex=0.8, lab.cex = 0.8), sub=mysub)
}
dev.off()
if (par2 != 'ALL'){
if (par3 == 'TRUE'){
ylab = 'cluster'
} else {
xlab = 'cluster'
}
par2 <- as.numeric(par2)
memb <- cutree(hc, k = par2)
cent <- NULL
for(k in 1:par2){
cent <- rbind(cent, colMeans(x[memb == k, , drop = FALSE]))
}
hc1 <- hclust(dist(cent),method=par1, members = table(memb))
de <- as.dendrogram(hc1)
bitmap(file='test2.png')
if (par4 == 'TRUE'){
plot(de,main=main,ylab=ylab,xlab=xlab,horiz=par3, nodePar=list(pch = c(1,NA), cex=0.8, lab.cex = 0.8),type='t',center=T, sub=mysub)
} else {
plot(de,main=main,ylab=ylab,xlab=xlab,horiz=par3, nodePar=list(pch = c(1,NA), cex=0.8, lab.cex = 0.8), sub=mysub)
}
dev.off()
str(de)
}
load(file='createtable')
a<-table.start()
a<-table.row.start(a)
a<-table.element(a,'Summary of Dendrogram',2,TRUE)
a<-table.row.end(a)
a<-table.row.start(a)
a<-table.element(a,'Label',header=TRUE)
a<-table.element(a,'Height',header=TRUE)
a<-table.row.end(a)
num <- length(x[,1])-1
for (i in 1:num)
{
a<-table.row.start(a)
a<-table.element(a,hc$labels[i])
a<-table.element(a,hc$height[i])
a<-table.row.end(a)
}
a<-table.end(a)
table.save(a,file='mytable1.tab')
if (par2 != 'ALL'){
a<-table.start()
a<-table.row.start(a)
a<-table.element(a,'Summary of Cut Dendrogram',2,TRUE)
a<-table.row.end(a)
a<-table.row.start(a)
a<-table.element(a,'Label',header=TRUE)
a<-table.element(a,'Height',header=TRUE)
a<-table.row.end(a)
num <- par2-1
for (i in 1:num)
{
a<-table.row.start(a)
a<-table.element(a,i)
a<-table.element(a,hc1$height[i])
a<-table.row.end(a)
}
a<-table.end(a)
table.save(a,file='mytable2.tab')
}